

Most finance teams don't have an automation problem. They have a prioritization problem.
Walk into almost any SMB finance function that's tried to automate more than one thing, and you'll find the same graveyard: a half-connected AP tool nobody trusts, a reconciliation script that broke three months ago, a Zapier workflow that fires at random, and a "we should really automate the close" note sitting in someone's backlog since last fiscal year. None of these were bad ideas. They were just picked in the wrong order, or picked without asking whether the thing underneath them was stable enough to build on.
That's the real cost. Not the wasted subscription fees — the wasted sequence. When you automate a fragile process, you don't save time, you industrialize the mess. And when you automate something that depends on data you haven't cleaned yet, you get faster wrong answers.
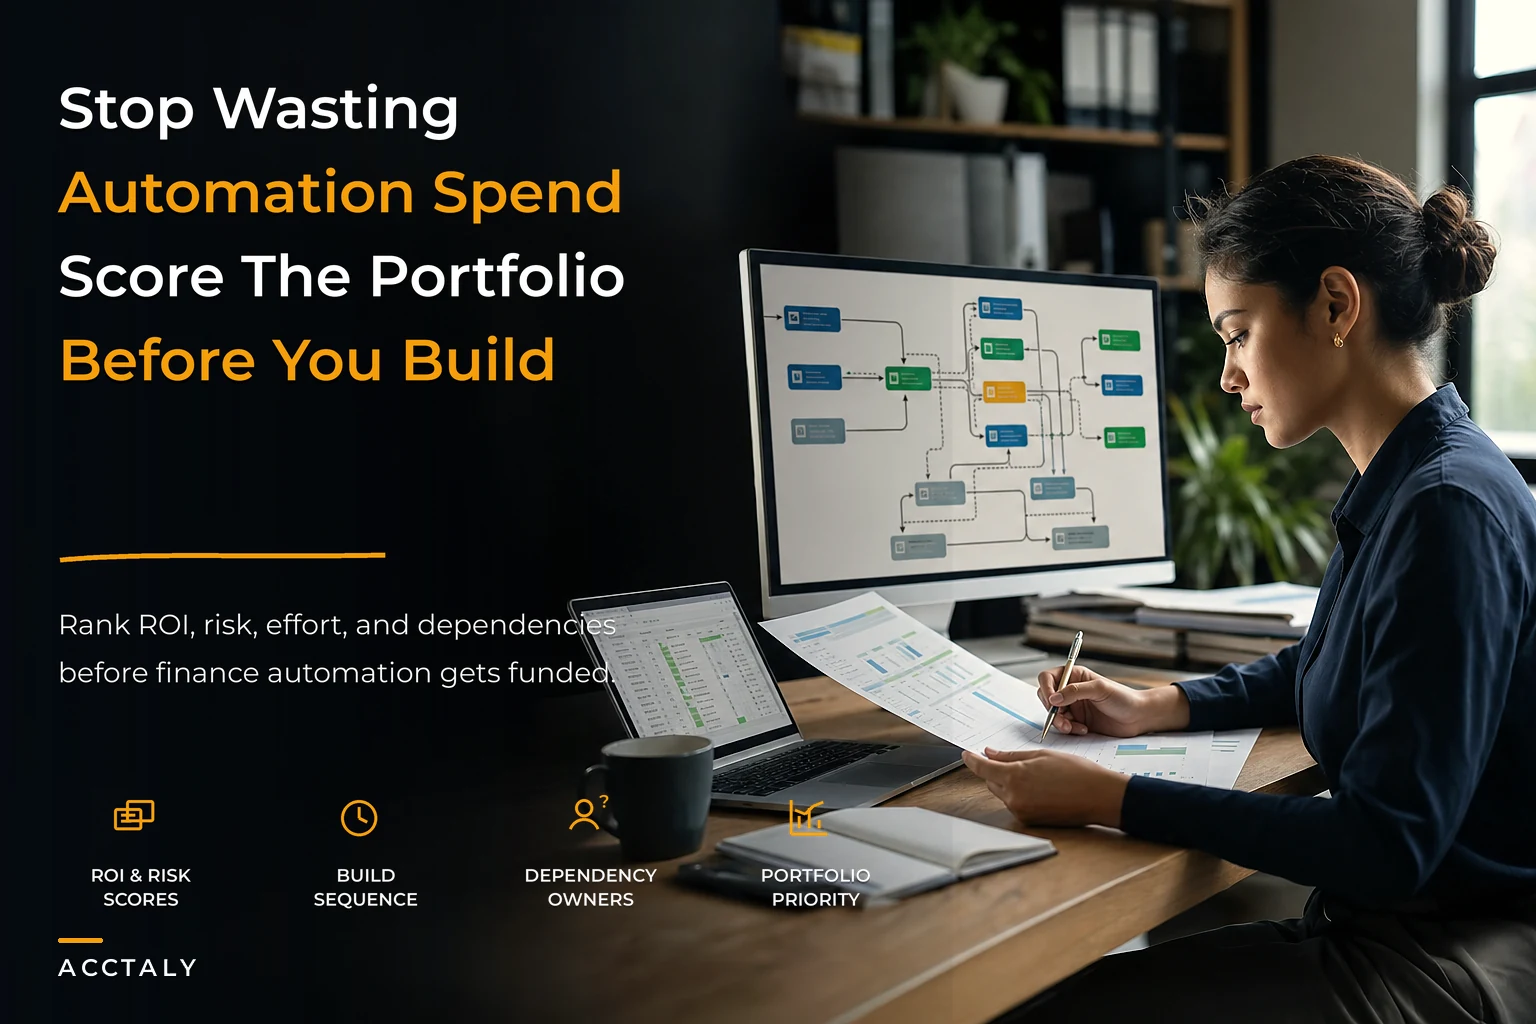
This is a playbook for treating finance automation like a portfolio instead of a wish list. The goal isn't to help you justify a single project. It's to give you a repeatable way to score every candidate against ROI, risk, effort, and dependencies — then sequence them so each investment makes the next one cheaper and safer. That's the actual difference between teams that compound their automation wins and teams that keep starting over.
Why finance automation spend gets wasted (and it's usually not the tool)
The default way SMBs decide what to automate is embarrassingly common: someone gets annoyed at a task, finds a tool that fixes that specific task, and buys it. The bank-fee reconciliation is painful this month, so we buy a fee tool. Next quarter the close is late, so we buy a close tool. Each decision is locally rational and collectively incoherent.
The deciding factor is almost never the tool's quality. It's three things nobody scored up front:
-
Dependencies. The automation depends on clean master data, a stable chart of accounts, or an upstream integration that itself isn't reliable.
-
Sequencing. The high-visibility project got done before the boring foundational one that would have made it work.
-
Effort blindness. Everyone estimated the software cost and nobody estimated the change cost — the process redesign, the training, the exception handling.
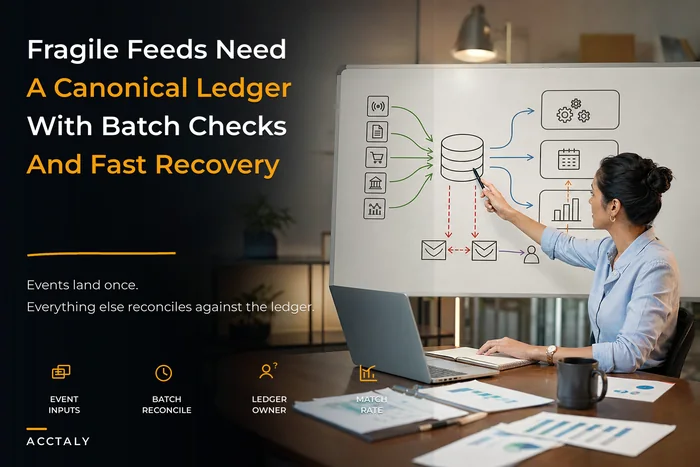
Finance automation fails in the gaps between systems, not inside any single system. A single tool usually works fine in a demo. It breaks when it has to consume data from something upstream that changes format, or hand off to something downstream that expects a different structure. If you've already dealt with the reality that fragile integrations quietly slow down your close, you know this — the individual automations were fine, the seams between them weren't.
So the portfolio question isn't "what should we automate?" It's "what should we automate first, given what everything else depends on?"
The four dimensions you actually have to score
Every automation candidate needs to be scored on four axes. Most teams score one (ROI) and wing the rest. That's how you end up with a high-ROI project that takes nine months because it sat on top of three unstable dependencies.
Stop letting accounting slow your business down.
Acctaly automates your financial operations so you can focus on growth and compliance.
- Automated bookkeeping
- Real-time financial reporting
- Integrated tax management
No credit card required
ROI. Time saved plus errors avoided plus cash unlocked. Be honest about which of the three you're actually claiming — "we'll save 10 hours a week" is a real number; "it'll improve accuracy" is not a number until you attach a cost to the errors.
Risk. What happens if this automation fails silently? Automating a low-stakes report is low risk. Automating payment approvals or revenue recognition is high risk, because a silent failure there is expensive and slow to detect. Higher risk doesn't mean don't do it — it means you need observability around it before you trust it.
Implementation effort. Software config plus process redesign plus people change. The last two usually dwarf the first. A tool that installs in an afternoon but requires rewriting your approval matrix and retraining eight people is not a low-effort project.
Dependencies. What has to be true, stable, and clean before this automation can work? This is the axis that quietly determines your whole sequence, and it's the one that gets skipped most.
An SMB-sized scoring matrix
| Dimension | 1 (worst for prioritizing) | 3 | 5 (best for prioritizing) |
|---|---|---|---|
| ROI | Saves <2 hrs/mo, no cash or error impact | Saves ~1 day/mo or catches recurring small errors | Saves multiple days/mo, unlocks cash, or kills a costly error class |
| Risk (if it fails) | Silent failure is expensive & hard to detect | Failure is annoying but caught within a cycle | Failure is obvious immediately, low blast radius |
| Effort (inverted) | Big process redesign + many people retrained | Moderate config + one process tweak | Config only, minimal behavior change |
| Dependencies | Blocked by unstable data or missing upstream systems | Depends on things that mostly work | Self-contained, foundational, unblocks others |
Two axes are inverted on purpose. High effort and heavy dependencies score low, so a higher total always means "do this sooner." Sum the four numbers and you get a rough 4–20 priority score. It's blunt, and that's the feature — you want to force conversations, not manufacture false precision.
One thing that trips teams up: a high-ROI project with terrible dependency and risk scores should not go first. If your shiny revenue-automation project scores 5 on ROI but 1 on dependencies and 1 on risk, its total will land it behind a boring master-data cleanup that scores 3-3-4-5. That's correct. That's the whole point.
Dependencies are the part everyone gets wrong
Teams score ROI carefully and treat dependencies as an afterthought. But dependencies are what determine whether the ROI ever shows up.
Think of your automation candidates as nodes in a graph, with arrows pointing to what they need to exist first. Almost every finance automation traces back to a small number of foundational nodes — and those foundational nodes are rarely the exciting ones.
[Clean master data] ─────┐ ├──> [Reliable reconciliation] [Stable chart of accts] ─┘ │ ├──> [Automated close] [Trusted integrations] ────────────┤ ├──> [Automated reporting / KPIs] [Approval / spend rules] ──> [AP automation] │ [Reconciliation + close] ──────────┴──> [Cash forecast automation] [Revenue recognition automation]
Here's a simple visual of that idea.

Read that top to bottom and the sequence writes itself. You can't trust automated reporting if reconciliation isn't reliable. You can't automate reconciliation if master data and the chart of accounts are shifting under you. You can't automate a cash forecast that pulls from a close that isn't stable.
The practical rule: nothing downstream should be automated before the node it depends on is stable enough that a human would trust its output without checking. If you'd still manually verify the input, automating the step on top of it just moves the verification — it doesn't remove it.
This is also why automation without observability is a trap. When you stack automations on top of each other, a silent failure at a foundational node cascades upward invisibly. You won't notice the master-data corruption in the reconciliation layer — you'll notice it three steps later in a forecast that's mysteriously off, and by then you're debugging four systems at once. Building observability and governance into your automations before you scale them is what keeps the graph from becoming a house of cards.
A dependency graph template you can fill in
-
What data does this consume, and who owns its accuracy today?
-
What system does it read from, and how stable is that integration?
-
What does it produce, and what downstream process consumes that output?
-
If the input is wrong, how long until someone notices?
Answer #4 for every node and you've basically found your risk scores for free. The nodes where "how long until someone notices" is measured in cycles, not hours, are the ones to automate carefully and instrument heavily.
The cost/benefit worksheet (copy this)
The scoring matrix tells you order. The cost/benefit worksheet tells you whether a given project clears the bar at all. Most SMB business cases fail because they count the benefits and forget half the costs.
Fill this in with ranges, not fake-precise numbers.
Benefits (annual)
-
Time saved
hrs/month × loaded hourly cost × 12 -
Errors avoided
estimated error frequency × avg cost per error -
Cash unlocked
faster collections / avoided late fees / captured discounts -
Risk reduction
qualitative — note it, don't fake a number
Costs (year one)
-
Software / subscription
-
Implementation & config time (internal hours count)
-
Process redesign time
-
Training & change management
-
Ongoing maintenance / monitoring (the line everyone forgets)
Net
-
Year-one net = benefits − year-one costs
-
Steady-state annual net = benefits − ongoing costs
-
Payback period in months
The single most-skipped line is ongoing maintenance and monitoring. Automations aren't set-and-forget. Integrations drift, source systems update, edge cases pile up. Budget roughly 15–20% of the initial build effort per year just to keep an automation healthy. If a candidate's benefit barely clears its build cost and you haven't priced maintenance, it's probably underwater.
A worked example: how the framework changes the order
Four candidates a typical 20-person services business might be weighing. All four are legitimate. The question is sequence.
| Candidate | ROI | Risk | Effort | Deps | Total |
|---|---|---|---|---|---|
| Master-data cleanup + owner rules | 3 | 4 | 3 | 5 | 15 |
| Automated bank reconciliation | 4 | 3 | 4 | 4 | 15 |
| AP approval routing automation | 4 | 3 | 3 | 3 | 13 |
| Automated revenue recognition | 5 | 1 | 2 | 1 | 9 |
The gut instinct is to start with revenue recognition — highest ROI, most painful, most visible to leadership. The matrix says start with master data and reconciliation instead. Revenue recognition's dependency and risk scores are both terrible: it depends on clean data and reliable reconciliation that don't exist yet, and a silent failure there is expensive and slow to catch.
Do rev-rec first and here's the realistic outcome: two-plus months building it, it works in testing, then it starts producing numbers your auditors and your own team don't trust because the underlying data is inconsistent. You've now got an expensive automation you have to babysit — which is worse than the manual process it replaced.
Do master data and reconciliation first, and rev-rec's effort score quietly climbs from a 2 to a 4 the next time you score it, because half its dependencies are now stable. Sequencing correctly doesn't just avoid failure — it makes later projects cheaper. That compounding is the entire argument for portfolio thinking.
Turning scores into a sequencing plan
Scores and dependencies give you raw material. A sequencing plan turns them into something a small team can actually execute without stalling.
A workable process:
-
List every candidate. Don't filter yet. Include the boring foundational ones.
-
Score all four axes on the 1–5 matrix. Force the numbers.
-
Draw the dependency graph. Mark which candidates are blocked and by what.
-
Pull foundational nodes forward regardless of their ROI score. These unblock everything.
-
Group into waves of 2–3 projects, not a giant parallel push.
-
Re-score after each wave. Stabilizing a foundation changes the effort and dependency scores of everything downstream.
Force a hard 1–5 score even when you're tempted to hedge — the conflict surfaces the real dependencies.
That last step is what makes this a repeatable roadmap instead of a one-time ranking. Your scores aren't permanent. Every completed foundational project quietly re-ranks the backlog.
Sample sequencing plan (SMB, ~4 quarters)
-
Wave 1 — Foundations Master-data ownership + chart-of-accounts stabilization. Low glamour, high dependency score, unblocks nearly everything.
-
Wave 2 — Reliable inputs Automated bank reconciliation + integration monitoring. Now the data feeding everything is trustworthy and instrumented.
-
Wave 3 — Operational leverage AP approval routing + close checklist automation. These sit on stable inputs, so effort is lower than it would've been in Q1.
-
Wave 4 — High-value, high-risk Revenue recognition + cash-forecast automation. Deferred on purpose — now their dependencies exist and you can trust the output.
Sequencing high-risk, high-ROI work last feels wrong to a lot of owners. It shouldn't. You're not delaying value, you're waiting until the value is actually collectable instead of theoretical.
When this framework makes sense — and when it's overkill
When it makes sense. If you've got more than two or three automations in flight or on the backlog, and especially if any of them depend on each other, you need portfolio scoring. It also earns its keep the moment automation spend becomes something leadership actually asks about — a scored roadmap turns "trust me" into a defensible sequence.
When it's overkill. If you're a solo bookkeeper or a very early-stage team with one obvious automation to do, skip the matrix and just do the thing. Formal scoring for a single project is bureaucracy theater. The framework pays off when you have competing candidates, not one.
Who should not do this yet. If your foundational data is a genuine mess — no clear ownership, an unreliable chart of accounts, integrations that break weekly — don't score an automation portfolio. Fix the foundation first. Scoring candidates that all depend on broken infrastructure just produces a prioritized list of things you can't build. If you're not sure where your foundation stands, mapping yourself against a staged finance-ops maturity model will tell you whether you're ready to think in portfolios or still need to shore up the basics.
A real scenario
A regional professional-services firm, around 25 people, had bought four finance tools in eighteen months. The AP tool was underused because approvals still happened over email. The reconciliation tool threw exceptions nobody triaged. The reporting automation produced dashboards leadership had quietly stopped opening because the numbers occasionally disagreed with the accountant's.
Total spend was somewhere around $2k–$2.5k a month across the stack, and the finance lead honestly couldn't say which tool was earning its keep. The close was still taking roughly two weeks.
When they mapped it out, the problem was obvious in about an hour: three of the four automations depended on master data and a chart of accounts that nobody owned. They'd built the roof before the walls. They paused new automation entirely for a quarter, assigned clear master-data ownership, stabilized the chart of accounts, and got reconciliation actually trustworthy.
Then they re-scored. The reporting automation they'd nearly ripped out suddenly worked — same tool, now fed clean inputs. The close dropped to around six or seven days. They didn't buy anything new for two quarters. The outcome wasn't a heroic new tool; it was the same tools finally running in the right order, on a foundation that could hold them.
The takeaway
Finance automation isn't won by picking better tools. It's won by picking a better order. The teams that compound their wins score every candidate on ROI, risk, effort, and dependencies, map what depends on what, and sequence foundations before flash.
Do that, and each automation you ship lowers the cost and risk of the next one. Skip it, and you'll keep buying good tools that quietly fail in the gaps between systems — and keep wondering why the spend never turns into leverage. Build the roadmap once, re-score it as you go, and let the sequence do the heavy lifting.
Ready to take control of your finances?
Join over 2,000 businesses using Acctaly to simplify accounting, accelerate cash flow, and ensure tax readiness.