

Most SMB risk registers die the same way. Somebody builds a spreadsheet during a compliance scramble or an insurance renewal, fills it with twenty-odd rows of "cyber breach," "key supplier failure," "AR concentration," color-codes everything red-amber-green, and then nobody touches it again until next year's scramble. It sits in a shared drive, technically complete, operationally useless.
The problem isn't the register itself. It's that a risk register and a funding decision live in two different languages. One speaks in likelihood and severity. The other speaks in dollars, payback, and "what do we cut to pay for this." Nobody translates between them. So the register never produces a single budget decision, and the business keeps absorbing losses that were sitting right there on the list the whole time.
This article is about building that translation layer. The goal is an SMB finance risk register that doesn't just catalog exposure — it ranks it, prices it, bands the remediation cost, and spits out a one-pager your board can approve or reject in a single meeting. No consultant frameworks. No enterprise GRC software. Just a pipeline that moves a risk from "we're worried about this" to "here's the authorization to spend $14k fixing it."
Why the register and the budget never talk to each other
Walk into most 10-to-50 person companies and you'll find the risk register owned by whoever drew the short straw — sometimes the controller, sometimes an office manager, occasionally an outside advisor who built it once and left. The budget, meanwhile, is owned by the founder or CFO and runs on a completely separate rhythm tied to the annual plan and whatever's on fire this quarter.
Because they're disconnected, two predictable failures keep showing up.
First, everything looks urgent and nothing gets funded. When a register is just a red-amber-green grid, half the rows end up amber or red. A founder staring at twelve "high" risks has no way to know which one to pay for first. So they fund none of them and hope. The register generated anxiety without generating a decision.
Second, the risks that do get funded are the loud ones, not the expensive ones. The supplier who threatens to cut you off gets attention. The slow, quiet revenue leak from a broken billing mapping — the one costing you $2k a month without anyone noticing — stays unfunded because nobody's shouting about it. Loudness and cost are only loosely related, and a register scored on gut feel can't tell them apart.
What you tend to see across smaller finance teams is that the register problem is actually a scoring problem wearing a process costume. If you can't price the rows, you can't rank them, and if you can't rank them, you can't build a pipeline. Everything downstream depends on getting the math honest.
Step one: score frequency and impact so the numbers mean something
Forget the 5x5 heat map for a second. Heat maps feel rigorous but they hide the one thing you need — a dollar figure. Score two axes, frequency and impact, but anchor both to real quantities instead of vibes.
Stop letting accounting slow your business down.
Acctaly automates your financial operations so you can focus on growth and compliance.
- Automated bookkeeping
- Real-time financial reporting
- Integrated tax management
No credit card required
Frequency is expected occurrences per year. Not "likely/unlikely" — an actual number or band.
| Score | Frequency band | Rough translation |
|---|---|---|
| 1 | Once every 5+ years | 0.2x/yr or less |
| 2 | Once every 2–4 years | ~0.3x/yr |
| 3 | Roughly once a year | ~1x/yr |
| 4 | A few times a year | 3–6x/yr |
| 5 | Monthly or more | 12x+/yr |
Impact is the dollar cost of a single occurrence — the cash you lose, spend, or fail to collect when the thing actually happens. Band it so you're not pretending to false precision:
| Score | Single-occurrence cost | Band midpoint used in calc |
|---|---|---|
| 1 | Under $2k | $1k |
| 2 | $2k–$10k | $6k |
| 3 | $10k–$40k | $25k |
| 4 | $40k–$150k | $90k |
| 5 | Over $150k | $200k+ |
The insight most people miss: frequency and impact are usually inversely related, and that's exactly why gut-feel scoring fails. The catastrophic stuff almost never happens. The cheap stuff happens constantly. A gut ranking over-weights the catastrophe because it's scary. The math corrects for this automatically once you multiply the two together — which is the whole point of the next step.
If you've already done the work of pricing control weaknesses, you're ahead. This scoring approach pairs directly with the method in Quantify finance-control gaps as dollar exposure for SMBs, which gets you the per-occurrence dollar figures the impact column needs.
Step two: expected loss, the number that actually drives funding
For each row:
Expected Annual Loss (EAL) = Frequency (occurrences/yr) × Impact ($/occurrence)
That's it. Use the band midpoints, not the scores, so the output stays in dollars. A risk that happens roughly once a year with a $25k impact carries an expected loss of about $25k/yr. A risk that happens monthly at $1k a pop carries $12k/yr. A once-in-five-years $200k event carries about $40k/yr.
Line those three up and the ranking is obvious — the "scary" $200k event and the "boring" $25k annual event are in the same league, and the monthly $1k nuisance is bigger than you'd ever guess by feel. That reordering is the entire value of the exercise.
| Risk | Freq (x/yr) | Impact ($) | EAL ($/yr) |
|---|---|---|---|
| Billing mapping errors leaking revenue | 12 | 1,800 | 21,600 |
| AR concentration — top client 40% of revenue | 0.3 | 120,000 | 36,000 |
| Payroll miscalc / penalty | 2 | 4,500 | 9,000 |
| Single-point bookkeeper, no backup | 0.5 | 30,000 | 15,000 |
| Unauthorized ACH / payment fraud | 0.3 | 60,000 | 18,000 |
| Failed month-end close delaying a financing draw | 1 | 22,000 | 22,000 |
Before this math, a founder would've funded the fraud and concentration risks first — the scary ones. After, you can see the quiet billing leak ($21.6k/yr) is nearly tied with concentration and bigger than the fraud exposure. It costs a fraction to fix. It should get funded first. Nobody would've ranked it that way from a heat map.
One honest caveat: EAL is a long-run average, not a prediction for next quarter. A $40k EAL built from a rare $200k event doesn't mean you'll lose $40k — it means you'll lose nothing most years and $200k once. That matters for contingency planning, which is why we separate "remediate" from "reserve" later. Don't let the average lull you into treating a tail risk like a steady drip.
Step three: band the remediation cost before you rank anything
EAL tells you what the risk costs you. It doesn't tell you what the fix costs. You need both, because a $22k/yr risk that costs $60k to fully eliminate is a worse buy than a $9k/yr risk you can kill for $1,500.
-
Band A — under $2k process change, a new approval rule, a reconciliation checklist. Mostly labor, little or no spend.
-
Band B — $2k–$10k a tool subscription, a part-time contractor, a one-time cleanup project.
-
Band C — $10k–$40k a hire, a meaningful system change, an insurance rider, a structural fix.
-
Band D — over $40k major structural change, redundant systems, significant headcount.
The number that actually drives the decision is the ratio of what you save to what you spend:
Remediation ROI = EAL reduced ÷ Remediation cost (annualized)
A fix that removes $21k/yr of expected loss for a $3k/yr tool and some process work has a ratio around 7x. That's a clear yes. A fix that removes $9k/yr for a $40k structural change sits near 0.2x — you'd be burning money to feel safe. The ratio is where most gut-driven funding goes wrong: people pay a lot to eliminate small risks and underpay on the cheap, high-return ones.
Worth flagging: remediation rarely takes a risk to zero. A billing-mapping fix might cut the leak by 80%, not 100%. Score the residual EAL honestly and base the ratio on EAL reduced, not total EAL. Teams that skip this overstate every ROI and then wonder why the losses didn't actually disappear.
Step four: budget-allocation rules so the pipeline runs itself
Once every row has an EAL, a remediation band, and an ROI, funding should be mostly mechanical. The point of rules is to stop every risk from turning into a debate. Here's a rule set that works for most SMBs:
-
Auto-fund Band A fixes with ROI above 3x. These are cheap, high-return, and not worth a meeting. Give the controller standing authority to execute them up to a monthly cap (say $2k total).
-
Queue Band B/C fixes with ROI above 2x for the next funding cycle. These get the one-pager treatment and a yes/no at the monthly or quarterly review.
-
Require explicit board sign-off for any Band D, regardless of ROI. Big structural spend shouldn't slip through on a formula.
-
Reserve, don't remediate, for low-frequency/high-impact rows where remediation ROI is under 1x. You can't cost-effectively prevent a rare catastrophe, so you fund a contingency instead.
-
Re-score anything "accepted" every two quarters. An accepted risk isn't a closed risk. Frequency drifts, impact grows as revenue grows.
The allocation rule that saves the most pain is the first one. In a lot of teams, cheap high-return fixes never happen because they're stuck behind the same approval process as a $40k decision. Giving them a fast lane with a spending cap is the single change that gets the most expected loss off the books in the first 90 days.
Give the controller a standing authority cap for Band A fixes so low-effort, high-return items actually get executed quickly.
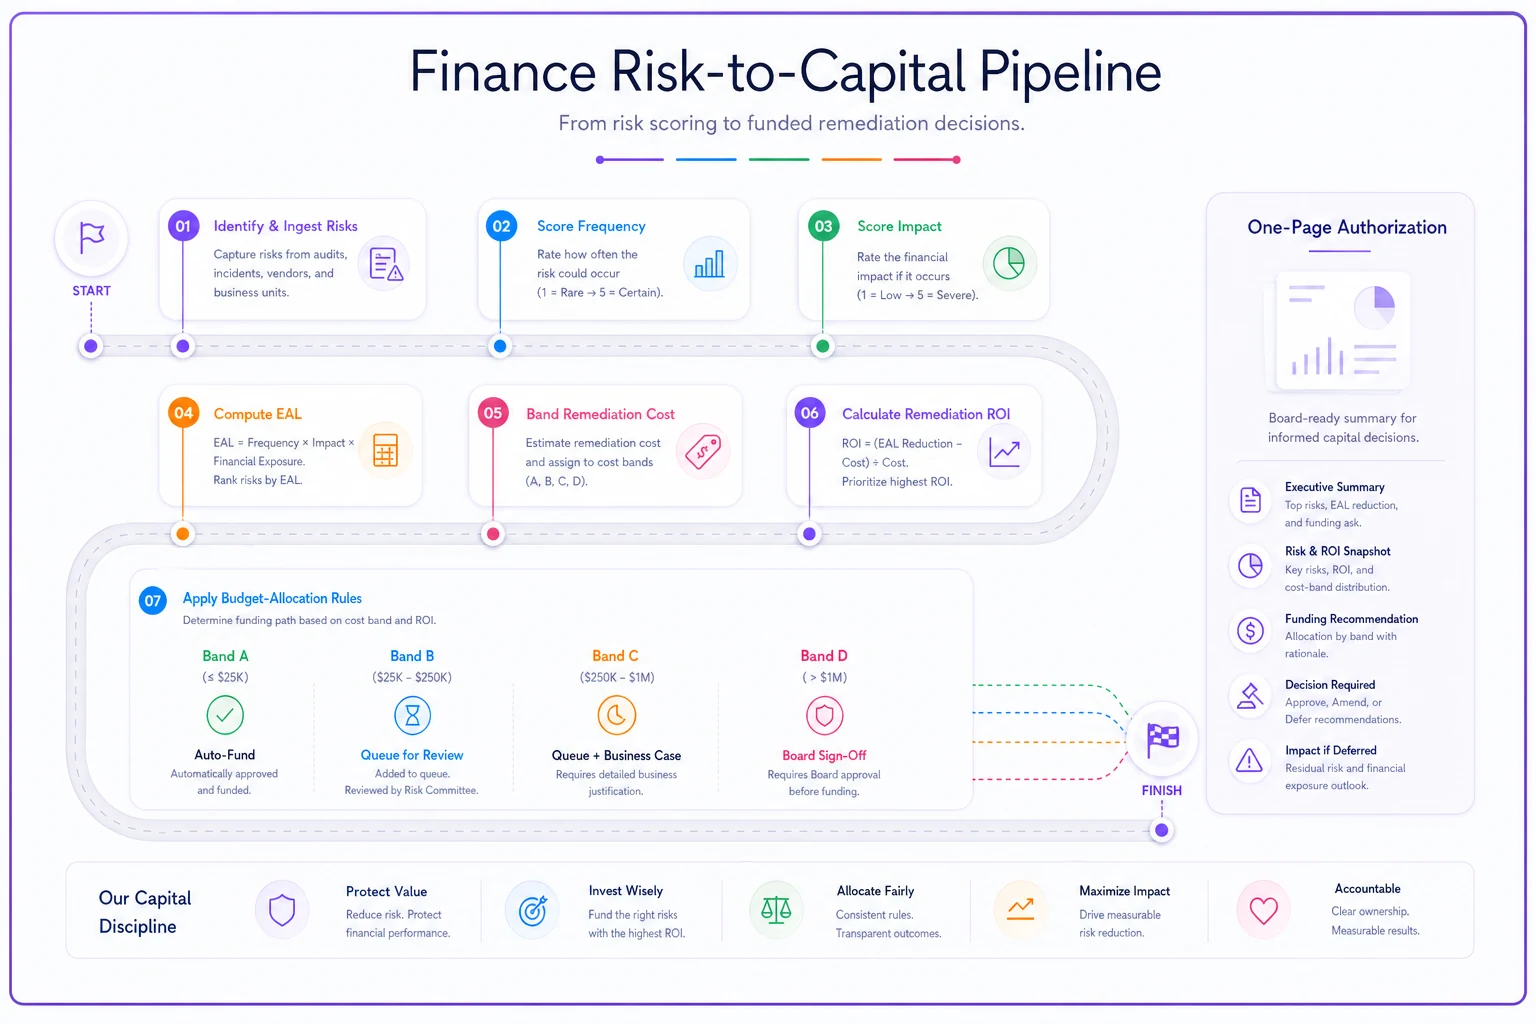
These funding gates work best when they're wired into how you already stage finance investment. If you run a maturity- or stage-based model, slot the risk pipeline into the same cadence described in A stage-aware finance compliance operating model for SMBs so you're not running two competing prioritization systems.
The contingency-funding playbook for the risks you can't fix
Some rows don't get a remediation — they get a reserve. The AR-concentration risk where one client is 40% of revenue is the classic example. You're not going to "fix" it in a quarter; you diversify over years. In the meantime, the honest move is to fund against it.
-
Size the reserve to the residual tail, not the EAL. For the concentration risk, you don't reserve the $36k EAL — you reserve against the cash gap a sudden loss would create. If losing that client means a 3-month runway hole of roughly $90k, that's your reserve target range, phased in.
-
Fund it incrementally out of a fixed percentage of monthly operating cash, not a lump sum you'll never set aside. One or two percent of monthly cash into a labeled reserve account builds the buffer without wrecking the plan.
-
Set a release condition. When concentration drops below 25%, the reserve releases back to working capital. Reserves without release conditions quietly become dead cash.
-
Keep remediation and contingency lines separate in the register so the board can see "we're actively fixing this" versus "we're carrying a buffer against this." Those are different decisions and mixing them confuses everyone.
The mistake here is funding a reserve and a remediation for the same risk at full size, which double-pays. If you're spending to reduce the risk, the reserve should shrink as the residual exposure drops. Tie them together.
The board one-pager that gets a decision in one meeting
Everything above exists to produce this. The board or founder doesn't want the forty-row register — they want the five rows that need money and a clean yes/no on each. The one-pager is the pipeline's output document.
Risk Capital One-Pager — structure:
-
- Line item short risk name
-
- Expected annual loss the EAL in dollars
-
- Current status unfunded / reserved / in remediation
-
- Proposed action remediate (Band + cost) or reserve (target)
-
- ROI or rationale savings-to-cost ratio, or why it's a reserve
-
- Ask the exact dollar authorization requested
-
- Decision approve / defer / reject (filled in live)
> Billing mapping revenue leak — EAL ~$21.6k/yr — Status: unfunded — Action: remediate, Band B ($3k tool + ~$2k cleanup) — ROI ~4.3x first year — Ask: $5,000 one-time + $3k/yr — Decision: ☐
Five rows like that, a total ask at the bottom, and a running total of expected loss removed. A founder can approve that in fifteen minutes because every row already answers "what does it cost me, what does it save me, what am I authorizing." That clarity is also what diligence-ready operators tend to need — if you're approaching a financing event, this same discipline feeds directly into the materials covered in Prepare a stage-tailored investor diligence pack.
A copy-ready capital-authorization template
Paste this into whatever your approval chain uses. It's deliberately short — SMBs don't need a procurement form, they need a traceable yes.
CAPITAL AUTHORIZATION — RISK REMEDIATION Risk ID / Name: Register EAL (annual): $__ Remediation band: A / B / C / D One-time cost: $ Recurring cost: $/yr EAL reduced (annualized): $__ Remediation ROI: x Residual EAL after fix: $__ Funding source: ☐ Opex reallocation ☐ Contingency ☐ New spend Spend authority under rule: ☐ Auto (Band A <$2k) ☐ Cycle review ☐ Board Approver: Date: __ Authorized amount: $__ Review date (re-score): _
The two fields people skip are residual EAL and review date. Skipping residual means you never check whether the fix actually worked. Skipping the review date means a "solved" risk silently grows back. Both turn a one-time authorization into an accountable loop.
A short real scenario
A roughly 30-person professional services firm, around $6M revenue, built one of these out of a messy 25-row register. Their old approach: a red-amber-green sheet with nine "red" items and no funding attached to any of them.
After scoring, three rows carried nearly all the expected loss — a billing-mapping leak (~$20k/yr), a single-point-of-failure on their one bookkeeper (~$15k/yr), and a payroll penalty exposure (~$9k/yr). Combined EAL on those three sat around $44k/yr. Combined remediation came in Band A/B: a billing cleanup and tooling fix, documented bookkeeping backup and cross-training, and a payroll calculation control. Total first-year spend landed somewhere around $9k–$11k.
The remaining "red" items that had been generating all the anxiety? Mostly low-frequency tail risks that got moved to a modest phased reserve instead of eating remediation budget. Twelve months later the billing leak was largely gone and the close no longer depended on one person. The register stopped being a wall of red and became a two-page funding document the partners reviewed each quarter. The real change wasn't the money saved — it was that decisions finally got made.
When this is worth building — and when it isn't
Build it when you have enough rows that prioritization is genuinely hard (more than ten real risks), when losses are actually happening but nobody's funding fixes, or when you're approaching a financing event and need to show disciplined risk management. The pipeline pays for itself the first time it reorders your funding away from the loud-but-cheap risks toward the quiet-but-expensive ones.
Skip the full version if you're a sub-10-person shop with three obvious risks — you don't need an EAL model to know you should back up your one bookkeeper. Just do it. A heavy scoring exercise on a tiny register is procedure for its own sake.
Who should not run this as a solo project: whoever owns the risks shouldn't be the only one scoring them. People systematically under-rate the frequency of failures in their own area. Get a second set of eyes — the controller scoring the founder's commercial risks, the founder scoring the finance team's control risks. The cross-check is where the honest numbers come from.
The system view
The reason this works isn't the spreadsheet math — it's that it connects three things that normally never meet: the register (what could go wrong), the P&L (what it costs), and the capital plan (what you'll fund). Each of those usually lives with a different person on a different cadence, and the gaps between them are where losses hide. A risk sits unpriced, a leak runs unmeasured, a fix stays unfunded, and none of the three owners ever sees the full loop.
Put EAL in the middle and the loop closes. Risks get priced. Prices get ranked. Rankings produce a one-pager. The one-pager produces an authorization. The authorization produces a review date that feeds back into the register. It's a pipeline, not a document — and the difference is whether your register generates decisions or just generates anxiety once a year.
Start with the five rows you already suspect are costing you money. Price them honestly. You'll almost certainly find the ranking is wrong, the cheap fix is the urgent one, and the scary risk is better handled with a reserve than a scramble. That reordering, more than anything, is what a real finance risk register is for.
Ready to take control of your finances?
Join over 2,000 businesses using Acctaly to simplify accounting, accelerate cash flow, and ensure tax readiness.