

Most SMBs treat cash forecasting like weather reporting. Finance updates the 13-week rolling forecast every Monday, shares it in the management meeting, everyone nods thoughtfully, then nothing actually changes. Collections still chases whoever's loudest. AP pays whoever sends the most follow-up emails. Operations requests a $45k equipment purchase that would've been denied if anyone had checked what the forecast said three days ago.
The disconnect is structural. Your forecast lives in one system, collections works from aged AR reports in another, AP manages their queue in a third spreadsheet, and approvals run through email chains that nobody cross-references against cash projections. Even when the forecast screams "liquidity crunch in week 7," the day-to-day decisions that actually determine cash position keep running on autopilot.
Building a real cash operations system means connecting forecast outputs directly to operational gates. Not just "here's what cash looks like" but "when cash drops below X, these specific things happen." The forecast becomes the control system, not the report.
Why cash forecasts fail to drive operational changes
After watching countless SMB finance teams build increasingly sophisticated forecasts that change absolutely nothing about daily operations, the pattern becomes obvious. The forecast exists in isolation from the workflows that actually move cash.
Take a typical wholesale distributor doing $8M annually. Their controller spends six hours building a detailed 13-week forecast showing a $200k shortfall in week 8 unless collections accelerates. The forecast gets emailed to the CEO and sales director. Meanwhile, the AR clerk continues working through their standard collection sequence, calling customers alphabetically. The purchasing manager approves a $30k inventory order because "we always restock when inventory hits 20% of capacity." Nobody connects these decisions to the forecast that predicted exactly this problem.
The failure isn't laziness or incompetence. Forecasts output information, not instructions. They tell you what might happen, not what to do about it. Most SMBs just don't have the operational infrastructure to translate forecast scenarios into specific actions that cascade through the organization.
Three things kill forecast effectiveness in practice:
Threshold ambiguity — The forecast shows declining cash but doesn't specify exactly when to change behavior. Is $500k the danger zone? $300k? $150k? Without explicit thresholds tied to actions, every interpretation becomes a judgment call made differently by each person.
Handoff gaps — Even with clear thresholds, there's no mechanism to trigger the right actions. Finance identifies a cash crunch but has no systematic way to reprioritize collections or freeze discretionary spending. The information stops at the forecast.
Decision fatigue — When every AP payment and collection call requires manual consideration against the forecast, teams default to their normal routines. Constantly cross-referencing decisions against projections burns people out within weeks.
The businesses that actually change outcomes based on forecasts don't just model better — they build operational gates that automatically adjust based on forecast outputs.
Building decision thresholds that actually trigger action
A working cash operations system starts with explicit thresholds mapped to specific operational changes. Not guidelines or suggestions — hard triggers that adjust workflows across the organization.
Stop letting accounting slow your business down.
Acctaly automates your financial operations so you can focus on growth and compliance.
- Automated bookkeeping
- Real-time financial reporting
- Integrated tax management
No credit card required
Start with three threshold levels that cover most SMB cash scenarios:
Green zone (comfortable operations): Cash position above 45 days of operating expenses
-
Standard payment terms honored
-
Normal collection cycles
-
Discretionary spending approved at department level
-
CapEx under $10k approved by department heads
Yellow zone (selective tightening): Cash between 20–45 days of operating expenses
-
Payment terms extended to net-45 for non-critical vendors
-
Top 20% of AR balances escalated to daily follow-up
-
Discretionary spending requires CFO approval
-
All CapEx requires executive approval regardless of amount
Red zone (cash preservation): Cash below 20 days of operating expenses
-
Only critical vendors paid (payroll, rent, core suppliers)
-
All AR over 30 days receives daily contact
-
Discretionary spending frozen
-
CapEx suspended except emergency repairs
The specific thresholds depend on your business model. A consulting firm with predictable monthly retainers might operate fine at 30 days cash. A seasonal retailer might need 60 days as baseline. The point is making the thresholds explicit and non-negotiable.
Here's what this looked like for a $3M marketing agency that implemented threshold-based operations. Their standard burn rate was roughly $250k monthly. They set thresholds at $375k (red), $625k (yellow), and $1.1M (green). When cash dipped below $625k in March, three things happened automatically:
-
Their accounting system flagged all invoices over $5k as "collection priority"
-
AP aging reports highlighted which vendors could extend to 45 days without service disruption
-
The project management system blocked new contractor agreements without partner approval
No meetings, no debates. The thresholds triggered operational changes that preserved an extra $180k over six weeks — enough to bridge a delayed client payment without touching their credit line.
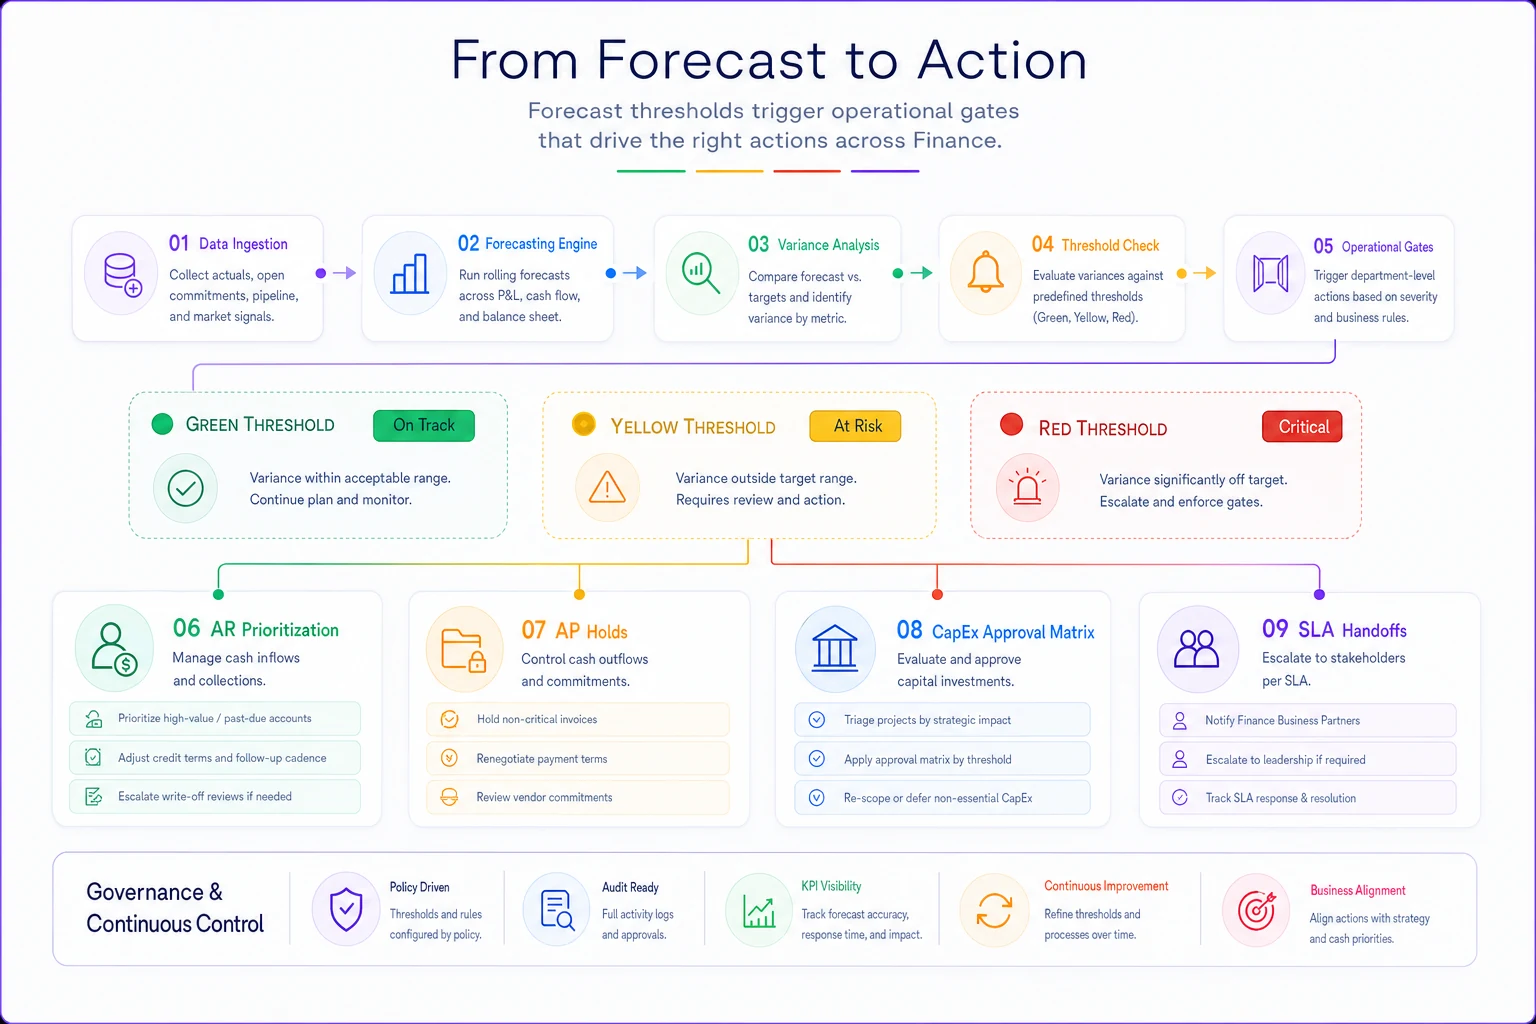
The diagram maps thresholds to the actions teams take automatically.
Start with conservative thresholds and track override frequency for the first 90 days to recalibrate practical trigger points.
The thresholds become the control system rather than a weekly status update.
Mapping forecast outputs to AR prioritization
The biggest cash impact from forecast-driven operations usually comes from collections. Instead of working through AR based on age or amount, you prioritize based on forecast impact and collection probability.
-
Squeaky wheel (whoever complains loudest gets called first)
-
Aged ladder (oldest invoices first, regardless of amount or customer)
-
Round robin (equal attention to all accounts)
A forecast-driven AR system prioritizes differently:
Week 1–2 forecast gap: Focus on quick-pay customers with existing relationships. The landscape contractor who always pays within 48 hours of a phone call. The restaurant that processes ACH same-day if you call before noon. These aren't necessarily your biggest balances, but they're your highest-probability collections that move immediate cash.
Week 3–6 forecast gap: Target large balances from reliable payers. The retail chain that takes 45 days but always pays in full. The hospital system that's slow but consistent. You're trading collection effort now for predictable cash later.
Week 7–13 forecast gap: Work disputed invoices and payment plan negotiations. The client questioning $30k in charges who needs documentation. The customer requesting 90-day terms who might accept 60 with a 2% discount. These take longer but fill future gaps.
When forecast triggers hit yellow or red zones, the prioritization intensifies:
| Forecast Zone | AR Priority | Collection Tactics |
|---|---|---|
| Green | Standard aging ladder | Email at 30/45/60 days |
| Yellow | Top 20% by balance | Phone calls at 15 days, daily after 30 |
| Red | All invoices >$5k | Daily contact, payment plans offered, services paused at 45 days |
A $4M equipment rental company shifted to forecast-driven collections and saw results pretty fast. Instead of their AR clerk calling through an alphabetical list, the system flagged specific invoices based on next week's forecast gap. If Monday's forecast showed a $75k shortfall by Friday, the system identified exactly which customers could fill that gap based on payment history and current balance. Collection effectiveness jumped from around $200k weekly to $340k when forecast gaps appeared.
Creating SLA-driven handoffs between functions
The most sophisticated forecasts still fail when departments operate in silos. Collections doesn't know what AP is planning to pay. Sales doesn't realize their 90-day term agreement just broke next month's cash position. Operations approves equipment purchases without seeing the forecast impact.
SLA-driven handoffs create forced coordination points triggered by forecast thresholds. Not optional meetings or suggested check-ins — required handoffs with specific deliverables and timelines.
Finance to Sales (24-hour SLA): List all customers with modified payment terms, expired contracts up for renewal, and prospects requesting extended terms. Sales must respond within one business day with expected collection dates or term pushback options.
Finance to Operations (48-hour SLA): Freeze on all purchase orders over $5k until cash position improves. Operations must provide a priority list of critical purchases with business impact if delayed.
AR to Customer Success (same-day SLA): Any customer flagged for collection calls gets a heads-up to customer success before contact. Success team has 4 hours to flag service issues that might impact payment.
AP to Procurement (72-hour SLA): List of vendors moving to extended payment terms with risk assessment. Procurement must confirm which vendors might suspend service or require deposits.
The handoffs aren't just information sharing — they're operational gates. A facilities management company with 200 commercial properties built SLA handoffs that kicked in whenever the forecast showed less than 30 days cash. Their property managers had 24 hours to identify which maintenance projects could delay without lease violations. AP got a ranked list of which vendors would accept 60-day terms without service disruption. The coordinated response typically freed up $150–200k within a week without any service degradation.
Covenant-aware gating for credit and loan compliance
SMBs with credit facilities or term loans often discover covenant breaches after they've already happened. The forecast might show adequate cash, but nobody tracked that the revolving credit draw pushed debt-to-EBITDA over 3.5x, triggering technical default.
Covenant-aware gating means building forecast scenarios that include not just cash position but also covenant calculations — then creating operational gates that prevent covenant breaches before they occur.
Common SMB covenants that need operational gates:
-
Minimum cash balance Many lines of credit require maintaining minimum operating cash (often $100–500k). The forecast needs to show not just total cash but "available cash" after the minimum balance.
-
Debt service coverage Typically requires 1.2x–1.5x EBITDA to debt service. Gates prevent new debt obligations when coverage drops below 1.5x to maintain buffer.
-
Working capital ratios Current ratio requirements (usually 1.1x–1.3x) mean managing AR collections and AP timing to maintain the ratio even during cash crunches.
-
CapEx restrictions Term loans often limit annual CapEx to a percentage of revenue or a fixed dollar amount. Gates track cumulative CapEx against limits.
Here's how covenant gates work in practice. A $6M food distributor had a $1.5M revolving credit facility with three covenants: minimum $200k cash, maximum 3x debt-to-EBITDA, and 1.25x debt service coverage. Their cash operations system tracked all three in the rolling forecast.
-
Block on all new equipment leases (would increase debt service)
-
Accelerated collection focus on top 10 customers (improve EBITDA)
-
Freeze on inventory purchases beyond 14-day forward demand (preserve cash)
The gates prevented the breach with two weeks to spare. Without them, they would've discovered the violation at month-end reporting — potentially triggering default rates or credit reduction.
The CapEx approval matrix that preserves runway
Capital expenditure decisions in most SMBs happen in isolation from cash forecasts. The warehouse manager needs a new forklift, demonstrates ROI, gets approval, and nobody checks if that $45k purchase just shortened runway from 8 months to 6 months.
A forecast-integrated CapEx matrix changes approval requirements based on cash position and runway impact:
| Cash Position | Runway Impact | Approval Requirement |
|---|---|---|
| Green zone | <5% runway reduction | Department head |
| Green zone | 5–15% runway reduction | CFO approval |
| Green zone | >15% runway reduction | Executive team |
| Yellow zone | Any reduction | CFO + CEO required |
| Red zone | Any amount | Suspended unless emergency |
But the matrix goes beyond simple approval levels. Each CapEx request must include:
-
Cash alternative analysis Lease vs. buy comparison with monthly cash impact. A $30k delivery vehicle might make sense to purchase in green zone but require leasing in yellow zone even if total cost is higher.
-
Deferral impact What happens if we delay 30, 60, 90 days? The server upgrade might be important but not catastrophic if delayed until cash improves.
-
Partial implementation options Can we achieve 80% of the benefit with 50% of the cost? Instead of replacing all warehouse lighting, do the high-traffic areas first.
A $5M logistics company integrated their CapEx approval with forecast thresholds and saw immediate discipline improvements. Previously, department heads would batch equipment requests at year-end, creating massive cash drains in Q4. The new system spread purchases across the year based on cash position. When cash was strong in Q2, they accelerated vehicle purchases planned for Q4. When cash tightened in Q3, they shifted to short-term rentals. Annual CapEx stayed roughly flat at around $400k, but the timing optimization freed up nearly $200k in working capital.
Building escalation paths when thresholds breach
Even the best forecast-driven system needs override capabilities for unusual situations. But overrides can't be arbitrary or the whole system collapses into "everything is an exception."
Structure escalations with increasing friction based on severity:
-
Level 1 override (department manager) Can approve a 10% variance from standard thresholds. A $6k purchase in yellow zone instead of the $5k limit. Requires written justification logged in the system.
-
Level 2 override (CFO) Can approve operations outside threshold rules for specific transactions. Paying a critical vendor in red zone who isn't on the approved list. Requires impact analysis and a recovery plan.
-
Level 3 override (CEO/Board) Can suspend threshold rules entirely for a defined period. A major customer bankruptcy might require operating outside normal parameters for 30 days. Requires board notification and daily cash reporting.
Track override frequency and patterns. If marketing constantly requests Level 1 overrides for contractor payments, the threshold might be wrong or the department needs different rules. If Level 2 overrides happen weekly, the system isn't calibrated to business reality.
A professional services firm with about 40 employees built escalation tracking into their cash operations system. They found that around 70% of overrides came from the same three scenarios: client project delays, contractor payment timing, and software renewal dates. Instead of treating these as exceptions, they built specific rules for each scenario. Override requests dropped by roughly 80% and the remaining ones were genuine edge cases.
When automated gates make sense (and when they don't)
Not every SMB needs a full forecast-driven gating system. The overhead might exceed the benefit depending on business model or growth stage.
Good candidates for automated gates:
-
Businesses with variable cash flow (seasonal, project-based, milestone billing)
-
Companies with debt covenants or investor reporting requirements
-
Organizations scaling quickly where manual oversight can't keep pace
-
Businesses with distributed decision-making (multiple locations, departments)
Poor candidates for automated gates:
-
Steady-state businesses with predictable cash flows
-
Companies under 10 employees where everyone sees everything
-
Businesses with a single decision-maker controlling all spending
-
Pure service businesses with minimal working capital needs
Even good candidates should phase implementation:
Phase 1 (Months 1–2): Basic thresholds and manual notifications. Finance sends alerts when thresholds breach but no automatic changes.
Phase 2 (Months 3–4): Automated AR prioritization and AP holds. System flags specific actions but requires human confirmation.
Phase 3 (Months 5–6): Full automation with override capabilities. Gates trigger automatically with escalation paths for exceptions.
A $12M manufacturing company tried implementing all gates simultaneously and nearly paralyzed operations. Purchase orders backed up, vendors threatened service cuts, and sales complained about collection calls to strategic accounts. They rolled back, implemented gradually over about 6 months, and eventually achieved the same controls with far less disruption.
The tooling challenge: spreadsheets vs. dedicated systems
Most SMBs start building cash operations systems in spreadsheets. It's tempting — you already have Excel, everyone knows how to use it, and you can customize endlessly. But spreadsheet-based gates hit scaling walls quickly.
Where spreadsheets work:
-
Under 50 transactions weekly
-
Simple threshold rules
-
Single person managing the system
-
Basic if/then logic
Where spreadsheets break:
-
Multiple departments needing real-time access
-
Complex covenant calculations
-
Audit trails for overrides
-
Integration with other systems
The evolution typically goes like this: you start with a master forecast spreadsheet with threshold calculations. Add a second sheet for AR priorities. Create a third for AP holds. Build a fourth for CapEx tracking. Before long you have 15 interconnected sheets that break whenever someone sorts the wrong column or forgets to update a formula.
Modern cash operations platforms designed for SMBs solve these problems by centralizing the forecast, thresholds, and operational gates in one place. When cash position changes, the system automatically recalculates all dependent rules, updates priorities across departments, and logs decisions for audit trails. The forecast becomes truly operational rather than informational.
The key is matching tools to your operational complexity. A 20-person services firm might run fine on enhanced spreadsheets with some basic automation. A 100-person distributor probably needs dedicated cash operations software that integrates with their ERP and manages the monthly close process systematically.
Real scenario: from forecast theater to operational control
Consider what this transformation looked like for a $7M specialty food importer. They had built an elaborate 13-week forecast model that took their controller two full days each month to update. Beautiful charts, detailed scenarios, comprehensive coverage. It changed absolutely nothing about daily operations.
Their cash swings were violent. One month sitting on $800k, the next scrambling to make payroll. The forecast predicted these swings accurately — but nobody acted on the predictions. Collections called customers randomly, AP paid whoever screamed loudest, and the warehouse ordered inventory based on gut feel about upcoming demand.
Month 1: Defined three cash zones based on operating expense coverage. Green above $600k (roughly 45 days), yellow from $300–600k, red below $300k. Started with manual alerts when zones changed.
Month 2: Built AR prioritization rules triggered by zones. In green, standard 30-day collections. In yellow, daily calls for invoices over $10k. In red, all invoices over $5k got immediate attention with payment plan options offered.
Month 3: Added AP gates and CapEx controls. Yellow zone extended payment terms to specialty vendors who historically accepted delays. Red zone limited payments to payroll, rent, and core food suppliers. CapEx required executive approval in yellow, suspended entirely in red.
The results weren't overnight but they were meaningful. First month, they prevented a credit line draw by accelerating $200k in collections when the forecast showed yellow zone approaching. Second month, they preserved $150k by strategically extending vendor payments without any service disruption. By month six, cash swings reduced from roughly +/- 60% monthly to +/- 20%.
More importantly, the forecast finally drove behavior. Department heads started checking cash position before making purchase decisions. Sales pushed back on extended payment terms when cash was tight. Operations planned inventory purchases around forecast valleys.
It wasn't perfect. They still hit unexpected crunches from customer bankruptcies and supplier minimum changes. But the baseline volatility dropped dramatically, and when surprises hit, everyone knew exactly what actions to take.
The path from reactive to predictive cash management
Building a real cash operations system isn't about perfecting your forecast model. It's about connecting forecast outputs to operational decisions through explicit thresholds, automated gates, and clear escalation paths.
Start simple. Define three cash zones and map them to specific actions. Build AR prioritization rules that kick in when cash tightens. Create AP hold lists that preserve cash without destroying vendor relationships. Add CapEx gates that prevent runway erosion from non-critical purchases.
The sophistication comes gradually. Layer in covenant tracking once basic thresholds work. Add SLA-driven handoffs after departments understand their triggers. Build override paths after you've seen which exceptions actually matter.
Most SMBs that implement forecast-driven operations see meaningful changes within 90 days. Not because the forecast gets more accurate, but because it finally connects to the decisions that determine cash position. The forecast stops being a report and starts being the control system that keeps the business stable through inevitable volatility.
The businesses that hold up through cash crunches aren't the ones with better forecasts — they're the ones whose forecasts automatically adjust operations before crisis hits. That's the difference between cash forecasting and cash operations. One tells you what might happen. The other makes sure your organization responds before it does.
Ready to take control of your finances?
Join over 2,000 businesses using Acctaly to simplify accounting, accelerate cash flow, and ensure tax readiness.