



Most businesses with blended revenue models calculate customer profitability wrong. They dump all revenue into one bucket, divide by customer count, and call it unit economics. Meanwhile, subscription customers quietly subsidize money-losing project work, or high-margin services mask unprofitable product lines nobody wants to examine too closely.
It gets messier when overhead enters the picture. A customer generating $2,000 monthly in subscriptions looks fine until you realize they're pulling 40+ hours of support time. Another customer ordering $8,000 in one-off projects seems lucrative until custom development quietly devours engineering capacity.
Getting customer unit economics right in mixed revenue environments means building allocation templates that track true costs across revenue streams—not just direct costs, but the hidden overhead that turns profitable-looking customers into quiet losses.
The Three Revenue Streams Fighting for the Same Overhead
In businesses running projects, subscriptions, and services simultaneously, each stream creates different cost patterns. Subscription customers generate predictable monthly revenue with low marginal cost. Project customers bring large upfront payments but require intensive resource allocation. Service customers fall somewhere in between.
The allocation problem starts with shared resources. Your account manager touches all three customer types. Your development team context-switches between subscription features, custom project work, and service delivery. Support handles tickets from everyone.
Traditional accounting tosses these costs into a general overhead pool and spreads them evenly. That approach makes high-touch project customers look more profitable than they are while making efficient subscription customers look worse.
Consider a digital agency running WordPress maintenance subscriptions, custom development projects, and monthly consulting services. Their P&L shows roughly 35% gross margins across the board. But when you actually dig into individual customer economics:
Subscription customers: Generate around $800/month with about 2 hours of monthly maintenance. True margin after allocation: somewhere around 68%.
Project customers: Generate $15,000 per project requiring 120 hours across three team members. True margin after allocation: closer to 22%.
Service customers: Generate $3,500/month with roughly 15 hours of consulting time. True margin after allocation: around 41%.
The business assumes projects drive profitability because of the dollar amounts. In reality, subscriptions generate nearly three times the margin percentage while consuming minimal resources.
Building Allocation Rules That Actually Reflect Resource Consumption
Useful allocation templates start with mapping resource consumption patterns, not revenue percentages. The goal is understanding which customers actually drive which costs.
Stop letting accounting slow your business down.
Acctaly automates your financial operations so you can focus on growth and compliance.
- Automated bookkeeping
- Real-time financial reporting
- Integrated tax management
No credit card required
Start with direct attribution wherever possible. If a developer logs 30 hours on a custom project, that's a direct cost. If a support rep handles 15 tickets for one subscription customer, track that time directly. This seems obvious, but plenty of businesses skip it and jump straight to percentage-based spreading.
-
Support costs allocate based on ticket volume
-
Account management allocates based on meeting frequency
-
Infrastructure costs allocate based on data usage or API calls
-
Development overhead allocates based on feature requests or customization hours
One SaaS company with consulting services discovered their enterprise customers—generating 60% of revenue—consumed 85% of support resources. Their old model split support costs proportionally to revenue. After switching to ticket-based allocation, several enterprise accounts turned out to be operating at negative margins despite the high contract values.
Three enterprise customers were generating around 900 support tickets monthly. Their entire SMB segment of 200 customers generated roughly 400. The enterprise deals looked profitable on paper and weren't.
Cohort Analysis Reveals Which Mix Actually Makes Money
Once allocation rules are in place, cohort analysis shows which customer combinations drive sustainable margins. Don't just look at individual customer profitability—track how different revenue mixes perform over time.
Group customers by their primary revenue stream, then look at secondary revenue participation. You might find that subscription customers who occasionally buy projects are your most profitable segment, while pure project customers drain resources.
Revenue mix percentages: Customers who are heavily subscription versus those splitting spend closer to 50/50 across streams.
Entry point: Customers who started with subscriptions then added services versus those who came in through a project.
Tenure bands: How profitability shifts as customers move between revenue streams over time.
Size brackets: Whether larger customers actually maintain margins across multiple revenue types.
A marketing automation platform tracked three cohorts over about 18 months. The subscription-first cohort started with $500/month plans, occasionally added $2,000 implementation projects, and averaged around $28,000 in lifetime value at roughly 45% margins. Project-first customers started with $10,000 implementations—some converted to subscriptions—but averaged closer to $22,000 lifetime value at 28% margins. A third cohort that bought both from day one landed around $31,000 lifetime value at 38% margins.
The insight that actually changed how they sold: project-first customers rarely converted to profitable subscription relationships. They expected project-level service throughout their subscription. Subscription-first customers treated projects as occasional add-ons and didn't carry those expectations with them. That behavioral difference is worth more than any spreadsheet adjustment.
The Overhead Mapping Rules That Change Everything
Standard overhead allocation uses revenue or headcount as the distribution base. For mixed revenue models, both distort unit economics. A better approach maps overhead to the activities that actually drive those costs.
Start by categorizing overhead into resource pools:
Customer-driven overhead: Support, account management, onboarding. Allocate based on interaction frequency or ticket volume.
Production-driven overhead: Development, QA, infrastructure. Allocate based on feature usage, customization requests, or compute consumption.
Transaction-driven overhead: Billing, collections, contract management. Allocate based on invoice frequency and payment complexity.
Growth-driven overhead: Sales, marketing, partnerships. Allocate based on acquisition channel and sales cycle length.
Here's how that plays out differently in practice:
| Overhead Category | Traditional Allocation | Activity-Based Allocation |
|---|---|---|
| Support Costs ($20k/month) | Split evenly across revenue | 70% to top 20 high-touch accounts |
| Development ($45k/month) | Pro-rata to revenue | 60% to custom projects, 40% to platform |
| Account Management ($15k/month) | By customer count | By meeting frequency + email volume |
| Infrastructure ($8k/month) | Equal distribution | By actual API calls and storage |
An e-learning platform found that their course creation tools—used by roughly 10% of customers—consumed close to 40% of infrastructure costs. Their old model spread infrastructure evenly, making standard subscription customers look less profitable than they actually were.
After switching to activity-based allocation, they raised prices on course creation features by about 35% and saw overall margins improve by 8 percentage points. Customers using heavy infrastructure started paying for it. Light users stopped subsidizing resource-intensive accounts.
Templates for Different Business Models
Different business structures need different allocation approaches. A professional services firm with productized offerings allocates very differently than a SaaS platform with implementation services.
For agencies with recurring services:
Track utilization rates by service type. A client on a $3,000/month retainer consuming 25 hours operates at very different margins than one consuming 10. Build templates that separate:
-
Base retainer allocation (fixed monthly hours)
-
Overage allocation (hourly work beyond retainer)
-
Project allocation (defined scope work)
-
Rush allocation (emergency or unplanned requests)
Map each employee's time to these categories weekly. Senior designers might spend 60% of their time on project work while junior designers handle 80% retainer tasks. That visibility lets you match resource costs to the revenue type generating them.
For SaaS with professional services:
Separate platform costs from service delivery costs completely. Engineering building core features is platform overhead. Consultants doing customer implementations are service delivery costs.
Track:
-
Platform development (benefits all customers)
-
Customer-specific development (direct allocation)
-
Implementation services (project-based allocation)
-
Success management (consumption-based allocation)
For product businesses with service layers:
Product margins look clean until you add installation, training, and support. Build templates that separate:
-
Product COGS (materials, manufacturing, shipping)
-
Service delivery costs (installation, training hours)
-
Ongoing support costs (warranty, maintenance)
-
Account management costs (relationship overhead)
A security hardware company assumed their $5,000 devices generated around 40% margins. After allocating installation and first-year support costs, actual margins came out closer to 18%. They restructured pricing to charge separately for installation and support—better transparency and better margins.
Monthly Reporting Recipes That Surface Hidden Losses
Static reports hide unit economics problems until they become critical. Build reporting structures that flag margin degradation before it hits cash flow.
A solid monthly reporting package includes:
Customer Margin Waterfall: Start with gross revenue, subtract direct costs, then layer overhead allocations to show true customer contribution. Break it into:
-
Revenue by type
-
Direct delivery costs
-
Allocated support costs
-
Allocated overhead
-
True contribution margin
Revenue Mix Evolution: Track how customer revenue composition shifts over time. A subscription customer adding more project work might signal margin pressure ahead.
Cohort Margin Trending: Compare margin trends across cohorts month-over-month. If January subscription cohorts hold at 45% margins while June cohorts sit at 30%, something changed in your acquisition or delivery model.
Resource Consumption Variance: Compare actual resource consumption against planned allocation. When project customers start consuming more support hours than modeled, margins erode quickly.
Build triggers that alert when:
-
Customer margins drop below a set threshold
-
Revenue mix shifts beyond target ranges
-
Resource consumption exceeds allocation assumptions
-
Cohort performance diverges from historicals
These reports need to be operational, not just informational. When a customer's margin drops below 20%, what happens next? Who gets notified? That question matters as much as the calculation itself.
Implementing Without Perfect Data
Most businesses delay unit economics work waiting for perfect data. You don't need complete time tracking or airtight overhead allocation to start. Build rough templates with reasonable assumptions, then refine as better data comes in.
-
Weeks 1–2 Identify your top 20% of customers by revenue. Build basic allocation templates for just these customers using rough estimates. Even approximate data reveals surprising margin variations.
-
Weeks 3–4 Create simple tracking mechanisms. Skip complex time tracking for now. Start with weekly allocation estimates from team leads—something like "this week I spent about 40% on Project X, 30% on subscriptions, 30% on services."
-
Month 2 Refine allocation rules based on initial findings. Add more customers to the model. Build basic reporting templates that update monthly.
-
Month 3 Implement systematic tracking for high-impact areas. If support costs drive margin variance, track tickets. If development resources matter most, track sprint allocation.
-
Ongoing Layer in automation as processes mature. Connect time tracking to billing systems. Build allocation models that pull from multiple data sources.
Focus initial efforts on your top revenue customers and iterate quickly—you'll uncover the biggest margin issues fastest.
One creative agency started this process with a spreadsheet covering just their top 10 clients. They found their largest client was operating at negative 12% margins after true cost allocation. That single finding triggered pricing conversations and service scope adjustments that otherwise wouldn't have happened for months—if ever.
When Mixed Revenue Models Actually Destroy Value
Sometimes the analysis reveals that mixed revenue models destroy value rather than create it. Managing multiple revenue streams adds operational complexity, and that complexity has a real cost.
Margin dilution: Each new revenue stream generates lower margins than your core business. Revenue grows but profitability shrinks.
Resource thrashing: Teams constantly switch contexts between delivery models, reducing efficiency everywhere.
Customer confusion: Clients don't understand your pricing or service boundaries, creating support overhead and satisfaction problems.
Operational complexity: The cost of managing multiple revenue streams exceeds whatever margin benefit diversification was supposed to bring.
A consulting firm offering subscriptions, projects, and workshops found that workshops—5% of revenue—consumed 20% of marketing resources and around 15% of partner time. After true cost allocation, workshops were running at negative 30% margins. They cut workshops entirely, focused on subscriptions and projects, and saw overall margins improve by 12 percentage points.
Sometimes the best thing an allocation template does is show you which revenue streams to stop offering.
Building Automated Reporting That Updates Without Manual Work
Manual allocation calculations become unsustainable as customer counts grow. Building automated reporting that calculates customer unit economics across mixed revenue streams catches problems faster than any spreadsheet.
Billing System → Revenue by Customer & Type Time Tracking / Tickets → Consumption Data Allocation Rules Engine → Overhead Distribution Reporting Layer → Margin Flags & Recommendations
Start by connecting your billing system to a database or operational software platform. Pull revenue by customer and type automatically. This eliminates manual categorization and the copy-paste errors that come with it.
Next, integrate time tracking or ticket systems. If you use project management tools, pull time allocations directly. Support ticket systems can feed customer interaction data automatically.
Then encode your allocation rules into the reporting system. Instead of manually calculating overhead distribution each month, let the logic run automatically. When overhead costs change, customer margins recalculate across the board.
Here's a simple workflow diagram for the automated reporting setup.
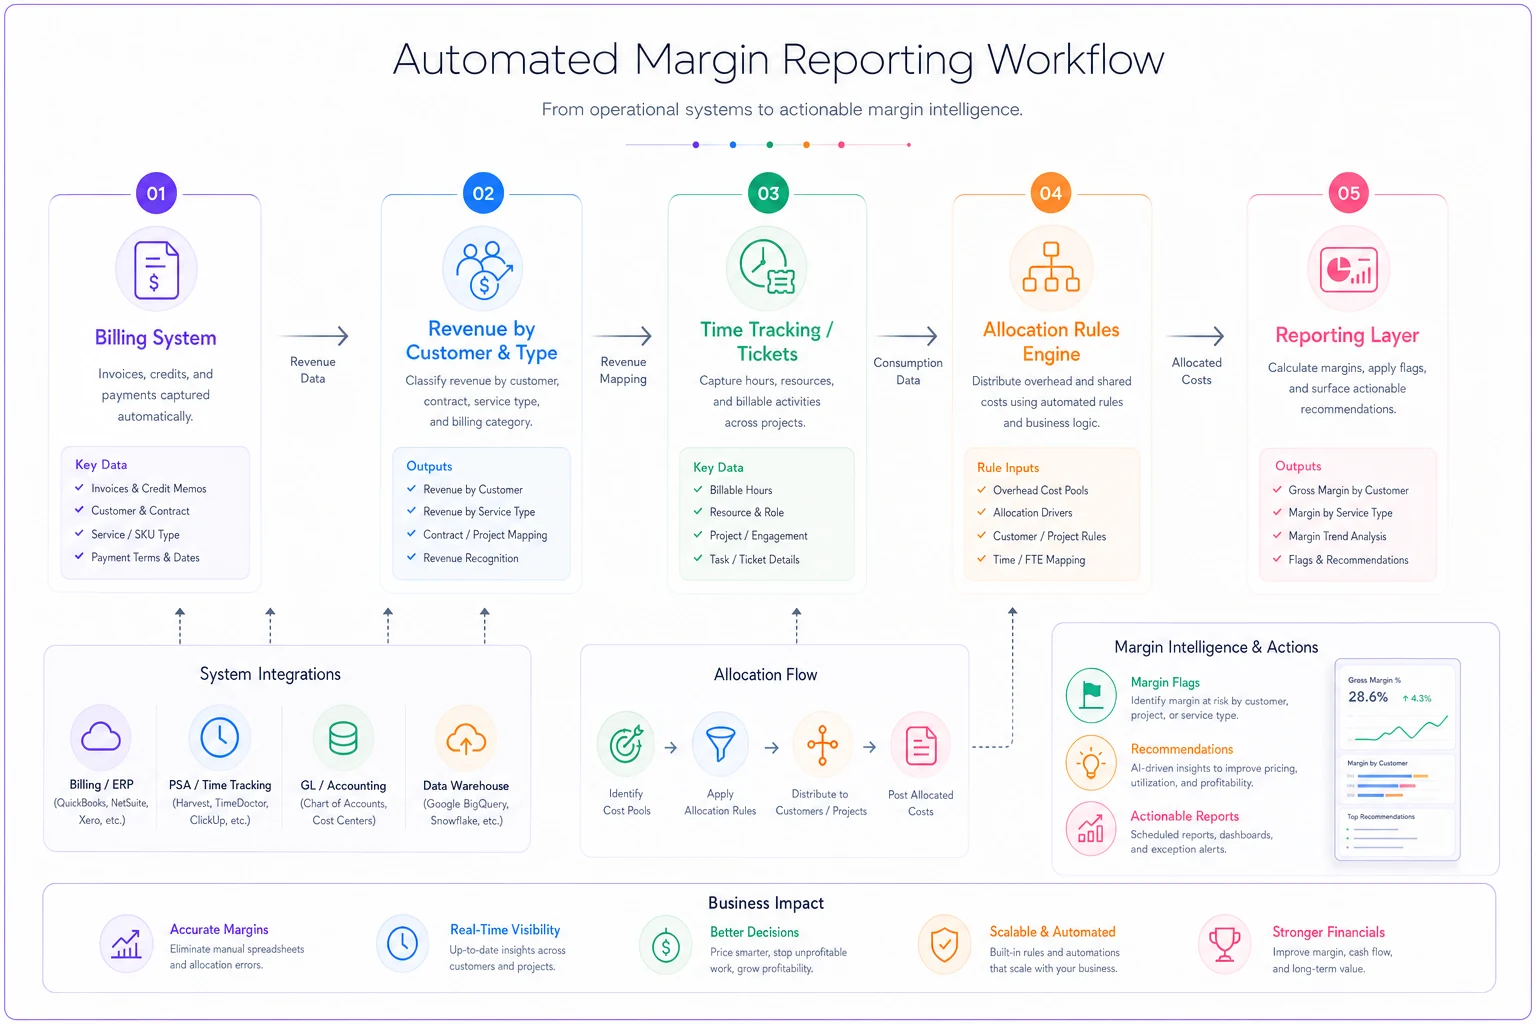
One digital services firm automated their entire margin reporting workflow using an AI-powered operational platform that pulls from billing, time tracking, support tickets, and accounting systems. The platform calculates true customer margins weekly, flags accounts below profitability thresholds, and surfaces recommendations for pricing or scope adjustments.
What took their finance team roughly three days monthly now runs continuously. More importantly, they catch margin problems weeks earlier because they're not waiting for month-end to run the numbers.
Making Unit Economics Drive Daily Decisions
The best allocation templates mean nothing if they don't change behavior. Customer unit economics analysis should influence sales compensation, delivery priorities, renewal conversations—all of it.
Share simplified margin data with customer-facing teams. Sales teams selling unprofitable deal structures need to see the downstream impact. Account managers maintaining negative-margin relationships need to understand what that actually costs the business.
-
Customers below 20% margins require VP approval for renewal
-
New deals with projected margins under 30% need pricing committee review
-
Service requests from negative-margin accounts get deprioritized
-
High-margin customers receive priority support and success resources
A B2B software company implemented margin-based account segmentation—organizing accounts by contribution margin rather than revenue size. Their reporting framework shifted from revenue-first to margin-first metrics.
High-margin accounts got dedicated success managers and priority feature requests. Low-margin accounts moved to self-service with automated resources. Negative-margin accounts faced renewal negotiations or service level adjustments.
Over about six months, average customer margins improved from 34% to 48%. Revenue grew slower, but profit grew faster. The company stopped celebrating every deal closed and started asking which customers were actually worth keeping.
That kind of shift isn't just a reporting change—it's cultural. Teams trained to chase revenue growth need to understand why a smaller, more profitable customer base creates more durable value than unsustainable expansion. Your chart of accounts structure should reflect this priority, breaking out revenue and costs in ways that surface margins at every level.
Calculating true customer unit economics in mixed revenue environments isn't just an accounting exercise—it reveals which parts of your business model actually create value. Most businesses with blended revenue streams operate with false confidence, assuming revenue diversity equals strength. Often it just equals complexity that quietly erodes margins over time.
The templates and allocation recipes here are a starting framework. The real value comes from applying them consistently, refining them for your specific model, and acting on what they reveal.
Start with rough allocations for your largest customers. Separate revenue streams. Map overhead consumption. Build simple monthly reports showing margin trends. Add sophistication over time as you learn which factors actually drive profitability in your context.
The businesses that get this right don't just track numbers better—they make better decisions about which customers to serve, which services to offer, and which revenue streams are worth keeping. In an environment where every business seems to offer subscriptions, projects, and services simultaneously, understanding true unit economics is often the difference between profitable growth and revenue that looks good on a dashboard while quietly losing money.
The path from mixed revenue chaos to clear unit economics isn't complicated. It requires commitment to understanding real costs, building allocation systems that reflect reality, and making decisions based on contribution margin rather than top-line revenue. The framework is here. The discipline to use it is the harder part.
Ready to take control of your finances?
Join over 2,000 businesses using Acctaly to simplify accounting, accelerate cash flow, and ensure tax readiness.