

Most businesses track the wrong numbers until something breaks. Usually around month eight, when cash mysteriously disappears despite "record revenue." Or when that aggressive growth push leaves you with three months of runway and no idea which customers are actually profitable.
The problem isn't tracking too few metrics. It's tracking metrics that tell you what happened instead of what's about to happen. Your P&L shows last month's revenue, but it won't tell you that your biggest client is about to churn. Your cash flow statement shows today's balance, but it won't reveal that your payment collection cycle just stretched from 32 to 47 days.
After building platforms for hundreds of businesses through these blindspots, patterns emerge. Service businesses burn cash on unprofitable projects they think are winners. SaaS companies celebrate MRR growth while their unit economics deteriorate. Retail operations maintain "healthy" margins while inventory turnover plummets.
Why traditional reporting fails modern business models
Traditional financial reporting was built for manufacturing and distribution—businesses where you buy materials, make something, sell it. Simple flow. Clear margins. Predictable cycles.
Modern business models break this framework completely. A marketing agency might have twelve projects running simultaneously, each with different resource requirements, timelines, and profitability profiles. Some projects lose money but secure strategic relationships. Others generate 60% margins but consume your best talent. Your standard P&L lumps everything together into "revenue" and "expenses."
SaaS businesses face an even bigger disconnect. You spend $8,000 acquiring a customer who pays $500 monthly. Traditional accounting shows an $7,500 loss. But if that customer stays for 24 months with 85% gross margins, you've actually secured $10,200 in gross profit. The reporting framework sees failure where operational reality shows success.
Retail complexity gets hidden until inventory starts choking your cash flow. That product showing 40% gross margin might sit in inventory for 120 days, tying up cash that could generate 3x returns elsewhere. Meanwhile, the 25% margin item that turns every 15 days actually drives more profit per dollar invested. Standard reporting misses this completely.
The core issue: traditional frameworks measure accounting accuracy, not operational health. They answer "what happened?" instead of "what should we do?"
The three-model framework that actually works
Different business models fail in fundamentally different ways. Service businesses die from project unprofitability and resource misallocation. SaaS companies fail from unsustainable unit economics hidden behind growth metrics. Retail operations collapse from inventory miscalculation and cash conversion problems.
Stop letting accounting slow your business down.
Acctaly automates your financial operations so you can focus on growth and compliance.
- Automated bookkeeping
- Real-time financial reporting
- Integrated tax management
No credit card required
Service business KPI architecture
Service businesses need visibility into project economics and resource utilization—not just monthly revenue.
Track realized hourly rates across all projects. Not what you bill—what you actually collect divided by hours worked. Most agencies discover they're making $47 per hour on projects they thought generated $125 per hour. The difference? Scope creep, non-billable fixing, endless revisions, and collection delays.
Utilization rates by role reveal the hidden drain. Your senior designers might show 78% billable utilization, which sounds healthy. But if they're spending 40% of their billable time on low-margin projects because junior staff can't handle the work, you're destroying profitability.
Pipeline concentration becomes critical around month six of operations. When 40% of revenue comes from one client, standard reporting shows strength. Operational reporting shows existential risk. Track revenue concentration by client, by project type, and by team member.
The killer metric most miss: project velocity. How long from signed contract to final payment? A project with 50% margins that takes four months to complete and collect generates less profit per month than a 30% margin project that completes in three weeks.
SaaS business KPI architecture
SaaS reporting frameworks fail when they focus on MRR without understanding the underlying unit economics.
Customer acquisition cost (CAC) is meaningless without segmentation. Your blended CAC might be $2,000, perfectly healthy for your $400/month average contract value. But dig deeper and you find enterprise customers cost $8,000 to acquire at $2,000/month, while SMB customers cost $400 at $200/month. One segment funds growth, the other destroys it.
Payback period by acquisition channel reveals where growth actually comes from. Organic search customers might pay back in 4 months, paid search in 8 months, and outbound sales in 14 months. But if outbound has 90% annual retention versus 60% for organic, the math shifts completely.
Track cohort behavior, not averages. Month 6 customers might show 5% monthly churn, but break it into cohorts and you see January signups churn at 12% while June signups churn at 2%. Something changed in your product, pricing, or market. Averaged metrics hide this.
Logo retention versus revenue retention tells different stories. Losing 20% of customers yearly sounds terrible. But if those customers represent 5% of revenue while your remaining customers expand 40% annually, you're actually growing efficiently. Track both, separately, by segment.
The most critical metric: gross margin by customer segment. That enterprise tier might generate $5,000 MRR, but if it requires dedicated support, custom features, and quarterly business reviews, the gross margin might be 40%. Meanwhile, self-serve SMB at $200 MRR could deliver 85% margins.
Retail business KPI architecture
Retail frameworks must balance inventory investment, cash conversion, and channel economics—complexity that traditional P&Ls completely obscure.
Gross margin return on inventory investment (GMROII) replaces simple margin analysis. That 60% margin product that turns twice yearly generates less return than the 30% margin product turning monthly. Calculate margin dollars per dollar invested in inventory, not just margin percentage.
Cash conversion cycles vary dramatically by product category and sales channel. Online sales might convert to cash in 3 days through payment processors. Wholesale could take 45-60 days with NET30 terms. Consignment inventory might not convert for 90+ days. The reporting framework must separate these cycles.
Channel profitability changes everything. Your store might show 35% margins overall. But the online channel generates 42% after lower overhead, while wholesale produces 22% after sales costs and payment terms. Growing the wrong channel destroys profitability despite revenue growth.
Inventory aging by SKU and location prevents the slow death of cash trapped in dead stock. Set thresholds: 0-30 days (full price), 31-60 days (watch list), 61-90 days (markdown consideration), 90+ days (liquidate).
| Age Range | Action |
|---|---|
| 0-30 days | full price |
| 31-60 days | watch list |
| 61-90 days | markdown consideration |
| 90+ days | liquidate |
Most retailers discover 20-30% of working capital trapped in 90+ day inventory.
Track true landed cost, not invoice cost. That product showing 50% margins based on purchase price might show 35% after freight, duties, payment terms costs, and warehousing. Your framework must capture total cost to sell, not just cost to buy.
Reporting cadence that prevents surprises
Daily reporting sounds responsible but creates noise. Monthly reporting sounds reasonable but hides problems. The right cadence depends on what you're tracking and why.
Daily dashboards (operational health)
-
Cash position and immediate receivables
-
Service
Today's billable hours logged
-
SaaS
Trial conversions and churn events
-
Retail
Sales velocity and inventory receipts
These aren't for decision-making—they're for pattern detection. You're watching for breaks in normal patterns, not analyzing individual numbers.
Weekly reporting (trajectory tracking)
-
Collections and cash forecast
-
Service
Project budget consumption and resource utilization
-
SaaS
Trial-to-paid conversion rate and support ticket trends
-
Retail
Inventory turn rate and channel performance
Weekly reports identify trends before they become problems. That gradual increase in collection time from 28 to 35 days over six weeks signals process breakdown before it creates cash crisis.
Monthly reporting (performance analysis)
-
Full P&L with segment breakdowns
-
Service
Project profitability and client concentration
-
SaaS
Cohort retention and unit economics
-
Retail
GMROII and aged inventory
Monthly analysis drives strategic adjustments. This is where you decide to fire unprofitable clients, adjust pricing, or shift inventory investment.
Quarterly reporting (strategic planning)
-
Trend analysis across all KPIs
-
Service
Client and project type profitability trends
-
SaaS
CAC payback and LTV/CAC by segment
-
Retail
Seasonal patterns and channel evolution
Monthly analysis drives strategic adjustments. This is where you decide to fire unprofitable clients, adjust pricing, or shift inventory investment.
Founder packs versus investor packs
Founders need operational truth. Investors want growth narrative. These aren't the same thing, and mixing them destroys both purposes.
Founder reporting essentials
Service businesses:
-
Project-level P&Ls showing which clients actually make money
-
Resource utilization showing who's drowning and who's idle
-
Pipeline concentration risk (% revenue from top 3 clients)
-
Collection aging by client
SaaS businesses:
-
Cohort retention curves, not blended rates
-
CAC payback by channel with failure rates
-
Support ticket volume per customer segment
-
Feature usage by pricing tier
Retail businesses:
-
SKU-level profitability including all costs
-
Inventory aging with markdown timeline
-
Channel CAC versus lifetime value
-
Return rates by product category
The founder pack answers: "What do I need to fix tomorrow?"
Investor reporting essentials
Service businesses:
-
Gross margin trend (showing operational leverage)
-
Customer lifetime value growth
-
Pipeline growth and diversity
-
Team utilization and capacity
SaaS businesses:
-
MRR growth and logo growth
-
Net revenue retention (the golden metric)
-
CAC payback period improvement
-
Market expansion metrics
Retail businesses:
-
Same-store sales growth
-
Inventory turnover improvement
-
Channel expansion success
-
Customer acquisition efficiency
The investor pack answers: "Why will this be 10x bigger?"
Never hide problems from investors, but frame them as solved challenges or clear action items, not existential threats. "Churn increased to 8% in Q2, implemented onboarding changes in Q3, already seeing reduction to 6.5%" beats pretending everything's perfect.
Building automation that scales with growth
Manual reporting breaks around $50K monthly revenue. Not because the volume's overwhelming, but because the complexity compounds. Fifteen projects across six clients with different billing terms and resource allocations. Four hundred SaaS customers across three tiers with various discounts and payment methods. Inventory across two locations with online, retail, and wholesale channels.
Spreadsheet templates work until someone forgets to update a formula, enters data in the wrong cell, or accidentally deletes three months of history. I've watched businesses make hiring decisions based on spreadsheet errors that showed 70% gross margins instead of the actual 45%.
AI-powered operational software handles this differently. Instead of building reports from financial data, it builds financial data from operational activity. Every project hour logged updates utilization. Every subscription change flows through to MRR. Every sale adjusts inventory and cash forecasts.
Start with data capture automation. Service businesses need time tracking that automatically calculates project profitability. SaaS companies need subscription management that tracks cohorts without manual tagging. Retail operations need POS systems that update inventory and cash positions in real-time.
Then add calculation automation:
-
Realized hourly rates from logged time and collected revenue
-
CAC from marketing spend and customer acquisition
-
GMROII from inventory investment and margin dollars
Finally, implement alert automation:
-
Alert when project budget consumption exceeds 80%
-
Flag when churn rate increases 20% week-over-week
-
Notify when inventory items hit aging thresholds
Start automation with the data capture that most frequently causes manual reconciliation errors.
Here's a simple workflow illustration of data sources feeding automated calculations and alerts.
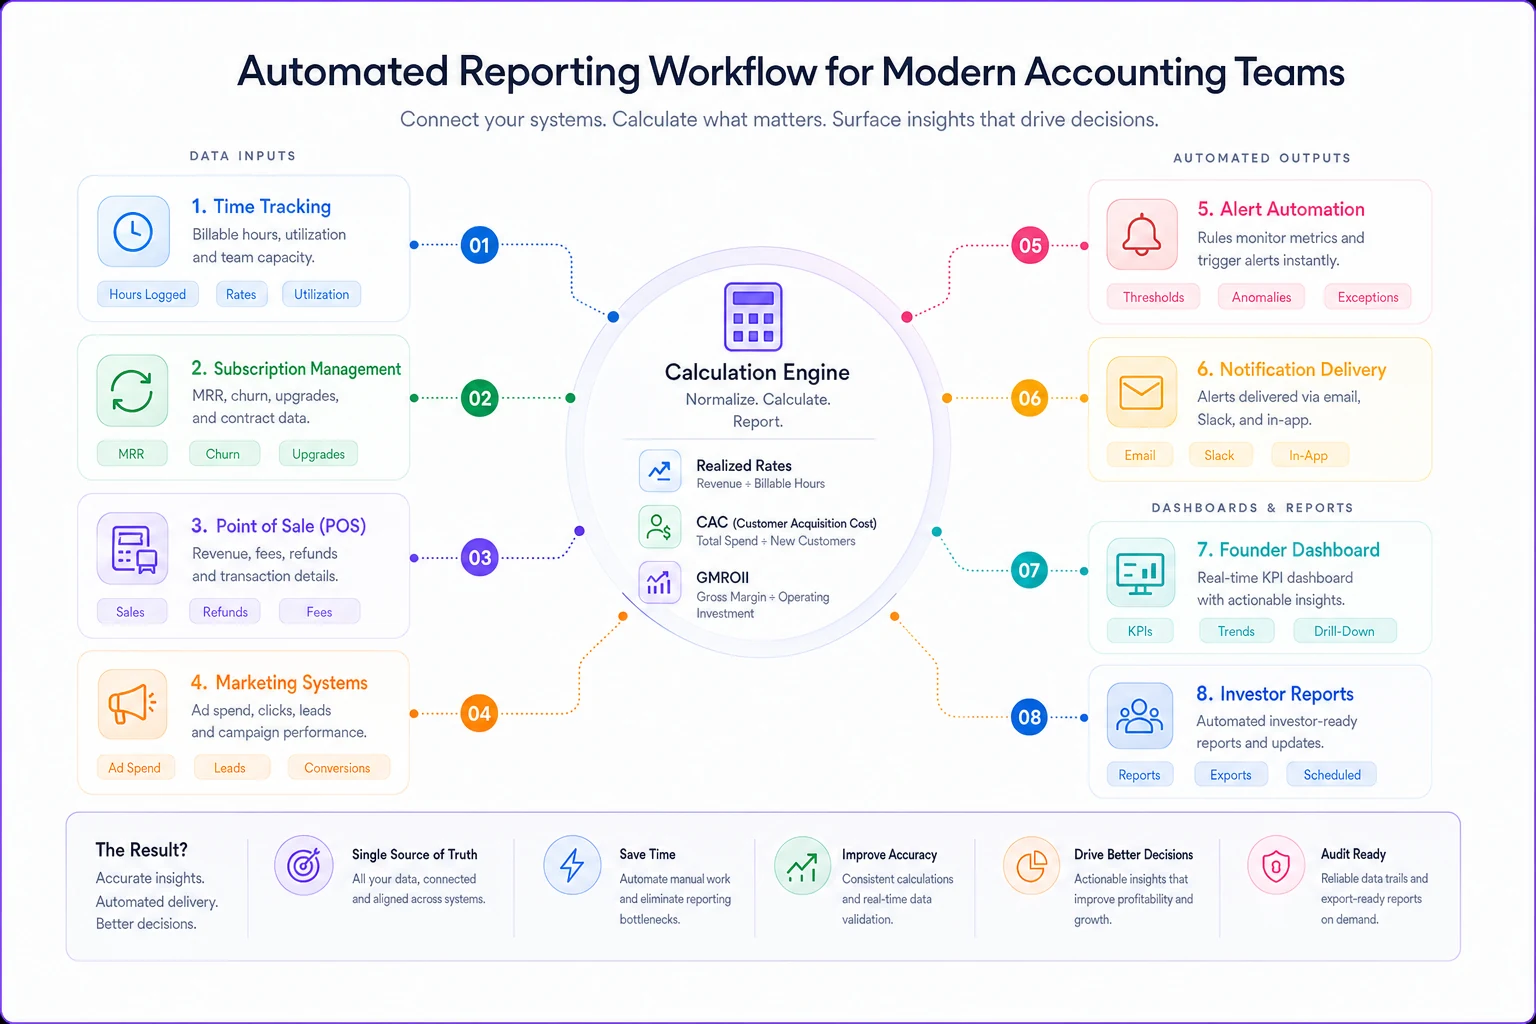
The point isn't replacing human judgment—it's freeing humans from data manipulation so they can focus on decisions. Automated reporting reveals problems. Human intelligence solves them.
Start with data capture automation. Service businesses need time tracking that automatically calculates project profitability. SaaS companies need subscription management that tracks cohorts without manual tagging. Retail operations need POS systems that update inventory and cash positions in real-time.
Common framework failures to avoid
The vanity metric trap
Total revenue, user count, and gross sales tell feel-good stories that hide operational decay. A service business celebrating "record revenue" while realized hourly rates plummet from $120 to $70. A SaaS company touting "10,000 users" while paid conversion drops from 12% to 4%. Retail operations showing "20% YoY growth" while inventory turnover extends from 45 to 90 days.
The over-segmentation paralysis
Breaking down every metric by every dimension creates analysis paralysis. You don't need CAC by channel by geography by customer size by acquisition month. Start with the single most important segment (usually customer type or channel), master that reporting, then carefully add dimensions that change decisions.
The historical focus mistake
Most reporting looks backward: last month's revenue, last quarter's churn, last year's growth. But operations need forward indicators: pipeline health, cohort trajectory, inventory commitment. Balance historical performance with forward-looking operational metrics.
The precision obsession
Calculating CAC to $1,847.23 when your acquisition process varies 40% month-to-month wastes effort. Rough accuracy beats precise inaccuracy. Use ranges, estimates, and directional indicators when precision doesn't change decisions.
Making this framework actually work
Implementation fails when businesses try to transform everything at once. Start with one critical metric that's currently invisible.
Service businesses: Begin with project-level gross margin. Pick your three largest active projects. Track hours, direct costs, and collections. Calculate realized margin. The gaps you find will shock you—projects you thought were profitable losing money, projects you considered break-even generating strong margins.
SaaS businesses: Start with cohort retention. Take last quarter's new customers. Track their month-by-month retention. Compare to the quarter before. The patterns will immediately reveal whether your product improvements are working.
Retail businesses: Begin with inventory turnover by category. Calculate how many days each category sits before selling. The variations will be dramatic—some categories turning in 20 days, others taking 120 days. This single metric transforms purchasing decisions.
Build from that foundation. Add one new metric weekly. Automate one calculation monthly. Within 90 days, you'll have reporting that actually drives decisions.
The framework isn't about perfect reporting—it's about useful reporting. Every metric should answer a specific question that changes behavior. Every report should highlight problems before they become crises. Every automation should free time for analysis instead of data entry.
Most businesses fail not from lack of information but from drowning in irrelevant metrics while missing critical signals. This framework cuts through the noise. It shows service businesses which projects to pursue and which to abandon. It reveals to SaaS companies which customers drive sustainable growth versus expensive churn. It tells retail operations which inventory investments generate returns versus tie up capital.
Your financial reporting framework becomes your operational advantage when it stops measuring what happened and starts predicting what will happen. When it stops tracking vanity metrics and starts exposing unit economics. When it stops requiring manual compilation and starts flowing from operational activity.
The businesses that scale successfully don't have more sophisticated frameworks—they have frameworks that match their business model, update automatically, and drive actual decisions. Build that, and the growth metrics investors want naturally follow. Because you're not growing despite operational reality—you're growing because you finally understand it.
Ready to take control of your finances?
Join over 2,000 businesses using Acctaly to simplify accounting, accelerate cash flow, and ensure tax readiness.