

Most small businesses build their chart of accounts backwards. They start recording transactions, create accounts as needed, then wonder why their financial reports look like alphabet soup when they need clean data for a loan application or investor pitch.
The real problem isn't just messy reports. It's that fixing a broken COA structure becomes exponentially harder as transaction volume grows. A construction company I worked with last year had to reclassify 18 months of transactions across 47 accounts just to understand their project margins. The owner spent three weeks in QuickBooks instead of bidding on new projects.
This pattern repeats across industries. The e-commerce brand with 200+ SKUs but no way to track category profitability. The consulting firm mixing project revenue with retainer income. The restaurant group unable to compare locations because each uses different account names for the same expenses.
Building your chart of accounts reactive-style guarantees headaches later. You might not feel the pain when you're processing 20 transactions per month, but wait until you hit 200. That's when inconsistent categorization, missing sub-accounts, and poor numbering schemes turn financial analysis into a nightmare.
Why traditional COA advice fails growing businesses
Standard accounting guidance tells you to use industry templates or copy QuickBooks defaults. These templates assume you'll stay exactly the size you are today, doing exactly what you do today, forever.
Real businesses pivot. They add service lines. They expand locations. They switch from project work to recurring revenue. They bring operations in-house that were previously outsourced. Each change requires account structure updates that ripple through years of historical data.
The traditional approach creates three specific problems that compound over time:
Account proliferation without purpose happens when different people create accounts at different times without checking what exists. You end up with "Office Supplies," "Office Supplies - Main," "Office Supplies - Warehouse," and "Supplies - Office" because nobody established naming conventions. Now you have four accounts tracking the same expense category, making any meaningful analysis require manual consolidation every single time.
Missing operational context means your P&L shows $47,000 in "Professional Services" last quarter, but you can't tell if that was legal fees, marketing consultants, IT contractors, or recruiting fees. Without sub-accounts or proper categorization, you're flying blind on where money actually goes. This becomes critical when you need to cut costs or justify spending increases.
Impossible comparisons surface when you open that second location or launch that new product line. Your existing COA structure can't segment performance. Everything flows into the same revenue and expense buckets. You know total revenue grew 30%, but can't tell if Location A is subsidizing Location B's losses.
The reporting-first design philosophy
Instead of building accounts around transactions, build them around decisions. Every account should answer a specific operational question you'll face as you grow.
Stop letting accounting slow your business down.
Acctaly automates your financial operations so you can focus on growth and compliance.
- Automated bookkeeping
- Real-time financial reporting
- Integrated tax management
No credit card required
A reporting-first COA starts with three core questions:
-
What decisions will I need to make with this data?
-
How will my business model evolve in the next 24 months?
-
What KPIs will lenders, investors, or buyers want to see?
This approach flips the traditional sequence. Instead of: Transactions → Accounts → Reports → Decisions
You design backwards: Decisions → Reports → Accounts → Transactions
Consider a home services company. They design their revenue accounts not just as "Service Revenue" but structure them as:
-
4100 - Residential Services
-
4110 - Residential HVAC Repair
-
4120 - Residential HVAC Installation
-
4130 - Residential Plumbing Repair
-
4140 - Residential Plumbing Installation
-
4200 - Commercial Services
-
4210 - Commercial HVAC Repair
-
4220 - Commercial HVAC Installation
-
4230 - Commercial Plumbing Repair
-
4240 - Commercial Plumbing Installation
Now they can instantly see residential vs commercial mix, repair vs installation revenue, and service line performance. When they add electrical services next year, the structure already accommodates it.
Building automation-ready numbering schemes
The numbering system you choose today determines how easily you can automate reporting, integrate systems, and maintain consistency as you grow. Most businesses learn this after they've already recorded thousands of transactions.
A scalable numbering scheme follows predictable patterns that both humans and software can parse. The structure should telegraph meaning through the numbers themselves.
The four-digit minimum rule
-
Never use three-digit account numbers. You'll run out of logical spaces faster than you think. Four digits give you room to insert related accounts without renumbering everything.
-
Instead of
-
400 - Revenue
-
401 - Service Revenue
-
402 - Product Revenue
-
Use
-
4000 - Revenue Summary (header account)
-
4100 - Service Revenue
-
4200 - Product Revenue
This leaves 4110-4190 for service revenue subcategories and 4210-4290 for product subcategories. You can add 4150 - Subscription Revenue without disrupting the logical flow.
Geographic and departmental encoding
-
If you'll operate multiple locations or departments, build that into your number structure now. A two-location retail business might use:
-
4100 - Product Sales - Location 01
-
4200 - Product Sales - Location 02
-
5100 - COGS - Location 01
-
5200 - COGS - Location 02
-
This breaks when you hit location 10. Better approach
-
41100 - Product Sales - Downtown
-
41200 - Product Sales - Suburbs
-
51100 - COGS - Downtown
-
51200 - COGS - Suburbs
-
The first digit indicates account type (4=revenue, 5=COGS), the second digit indicates the category, and digits 3-4 indicate location. This scales to 99 locations without restructuring.
The first digit indicates account type (4=revenue, 5=COGS), the second digit indicates the category, and digits 3-4 indicate location. This scales to 99 locations without restructuring.
Critical migration rules for growing businesses
The best COA structure becomes worthless if you can't migrate to it cleanly. Most businesses discover this after starting a "quick" restructure that turns into a six-month project.
The grandfather principle
Never delete or renumber accounts with historical transactions. Mark them inactive instead. Create new accounts with your improved structure and map old accounts to new ones for reporting. This preserves your audit trail and prevents mysterious balance changes.
Batch similar accounts before splitting
If you're moving from one "Advertising" account to separate "Digital Marketing," "Print Advertising," and "Event Sponsorship" accounts, don't try to reclassify transaction by transaction. First, review six months of transactions to establish rules. Then batch update using these rules, reviewing only the exceptions.
-
Facebook/Google charges → Digital Marketing
-
Local newspaper → Print Advertising
-
Trade show fees → Event Sponsorship
-
Everything else → review manually
The 80/20 reclassification rule
Focus reclassification efforts where they matter. If an account has $2,000 in annual transactions, spending hours categorizing each $50 expense won't improve decision-making. But that $47,000 "Professional Services" account needs proper segmentation.
These migration rules follow specific workflow sequences that prevent data corruption while maintaining operational continuity. Starting with the highest-impact accounts and working down ensures the most valuable insights appear first.
Industry-specific structures that actually scale
Generic templates fail because every industry has unique reporting needs. Here are field-tested structures for three common business models:
SaaS/Subscription Businesses
| Account Code | Account Name | Purpose |
|---|---|---|
| 4100 | New Subscription Revenue | Track customer acquisition |
| 4200 | Recurring Subscription Revenue | Monitor retention |
| 4300 | Expansion Revenue (upgrades) | Measure growth within accounts |
| 4400 | Reactivation Revenue | Track win-back success |
| 4500 | Professional Services Revenue | Separate consulting from SaaS |
| 4600 | One-time Setup Fees | Implementation revenue |
This structure immediately shows unit economics, CAC payback, and revenue quality metrics that investors expect.
Multi-location Retail/Restaurant
-
Set up 41xx for Location A Revenue (where xx = revenue type)
-
Use 42xx for Location B Revenue
-
Apply 43xx for Location C Revenue
-
Mirror with 51xx, 52xx, 53xx for location-specific COGS
-
Follow pattern for operating expenses with 61xx, 62xx, 63xx
-
Reserve 6900 for Corporate/Shared Expenses
This creates natural rollups while preserving location granularity.
Professional Services/Consulting
-
Create fixed-fee project revenue tracking (4100)
-
Separate time & materials billing (4200)
-
Track retainer relationships (4300)
-
Monitor recurring service streams (4400)
-
Account for training/workshop income (4500)
Direct costs follow the same logic with dedicated project labor, contractor expenses, and project-specific costs in separate buckets.
Common COA mistakes that surface during growth
Some account structure problems hide until transaction volume increases. By then, fixing them requires significant rework.
The "Other" explosion
"Other Revenue" and "Miscellaneous Expenses" become dumping grounds. A logistics company had $73,000 annually in "Other Expenses" — turned out 60% was vehicle maintenance that should have been tracked separately for DOT compliance. Create specific accounts for recurring items over $1,000 annually.
Mixing balance sheet and P&L concepts
Small businesses often create expense accounts for asset purchases. "Computer Expenses" might include both monthly software subscriptions (expenses) and laptop purchases (assets). This understates assets and overstates expenses, affecting both loan applications and tax filings.
Department vs. expense category confusion
Creating accounts like "Marketing - Salaries" and "Operations - Salaries" instead of "Salaries - Marketing" and "Salaries - Operations" makes total salary costs invisible without manual calculation. Keep the natural expense category as the primary account, with departments as sub-accounts or classes.
These problems multiply when you're processing hundreds of transactions monthly instead of dozens.
Setting up for operational intelligence
Modern businesses need more than tax categories. They need operational visibility. Your COA should support both compliance reporting and management decisions.
Consider this enhanced expense structure for a growing e-commerce business:
-
Customer Acquisition costs including paid advertising, influencer partnerships, and referral program expenses
-
Customer Retention spending on loyalty programs, service labor, and return processing
-
Fulfillment Operations covering warehouse labor, shipping, and packaging materials
-
Technology & Tools for platform fees, automation systems, and analytics
Now you can calculate customer acquisition cost (CAC), fulfillment cost per order, and technology spend as percentage of revenue — metrics that actually drive decisions.
The 18-month migration roadmap
Moving to a better COA structure doesn't happen overnight. A realistic timeline that minimizes disruption spreads the work across phases.
Months 1-3: Design and Documentation
Map your current state first. Export your existing COA and tag each account as keep, merge, split, create new, or retire. Document the business reason for each change. "Splitting Advertising into Digital and Traditional to track ROI separately" explains the change better than just showing new account numbers.
Months 4-6: Parallel Structure Testing
Create your new accounts but don't reclassify history yet. Start coding new transactions to both old and new structures. This reveals gaps in your mapping logic before you commit to the change.
A wholesale distributor found their new "Freight-In" and "Freight-Out" accounts didn't capture drop-ship scenarios during this phase. They added a third account before the full migration, avoiding later rework.
Months 7-9: Historical Migration
-
Vendor name mapping (Amazon → Office Supplies)
-
Description keywords (containing "fuel" → Vehicle Fuel)
-
Amount thresholds (under $100 → Small Tools)
-
Manual review of remaining exceptions
Months 10-12: System Integration Updates
Update integrated systems to use new account codes including point of sale systems, e-commerce platforms, expense management tools, and payroll systems. Test each integration thoroughly. A mismatched account code can cause synchronization failures that compound daily.
Months 13-18: Optimization and Training
Train team members on the new structure. Create a simple reference guide showing common transactions and their accounts, when to create new sub-accounts vs use existing ones, and approval requirements for new account creation.
Monitor account usage monthly. Merge underutilized accounts and split overloaded ones based on actual transaction patterns. This feedback loop prevents the structure from degrading over time.
When operational software accelerates COA benefits
The right account structure becomes exponentially more valuable when paired with operational software that can leverage it. AI-powered platforms can auto-categorize transactions, flag coding anomalies, and generate custom reports that would take hours to build manually.
Instead of manually reviewing credit card statements to split "Amazon" purchases between office supplies, inventory, and equipment, operational software with AI automation can learn your patterns and suggest the right accounts. It can also flag when someone codes inventory purchases to expense accounts, preventing the balance sheet distortions that complicate financing.
The key is that your COA structure must be logical enough for AI agents to understand patterns. Random account numbers and inconsistent naming conventions confuse both humans and software. With clean structure, AI automation maintains accuracy while processing 10x the transaction volume.
create an image depicting the workflow for AI-assisted transaction categorization: vendor and description input → automated model suggests account mapping → human review and approval → final posting to COA with feedback loop to improve the model
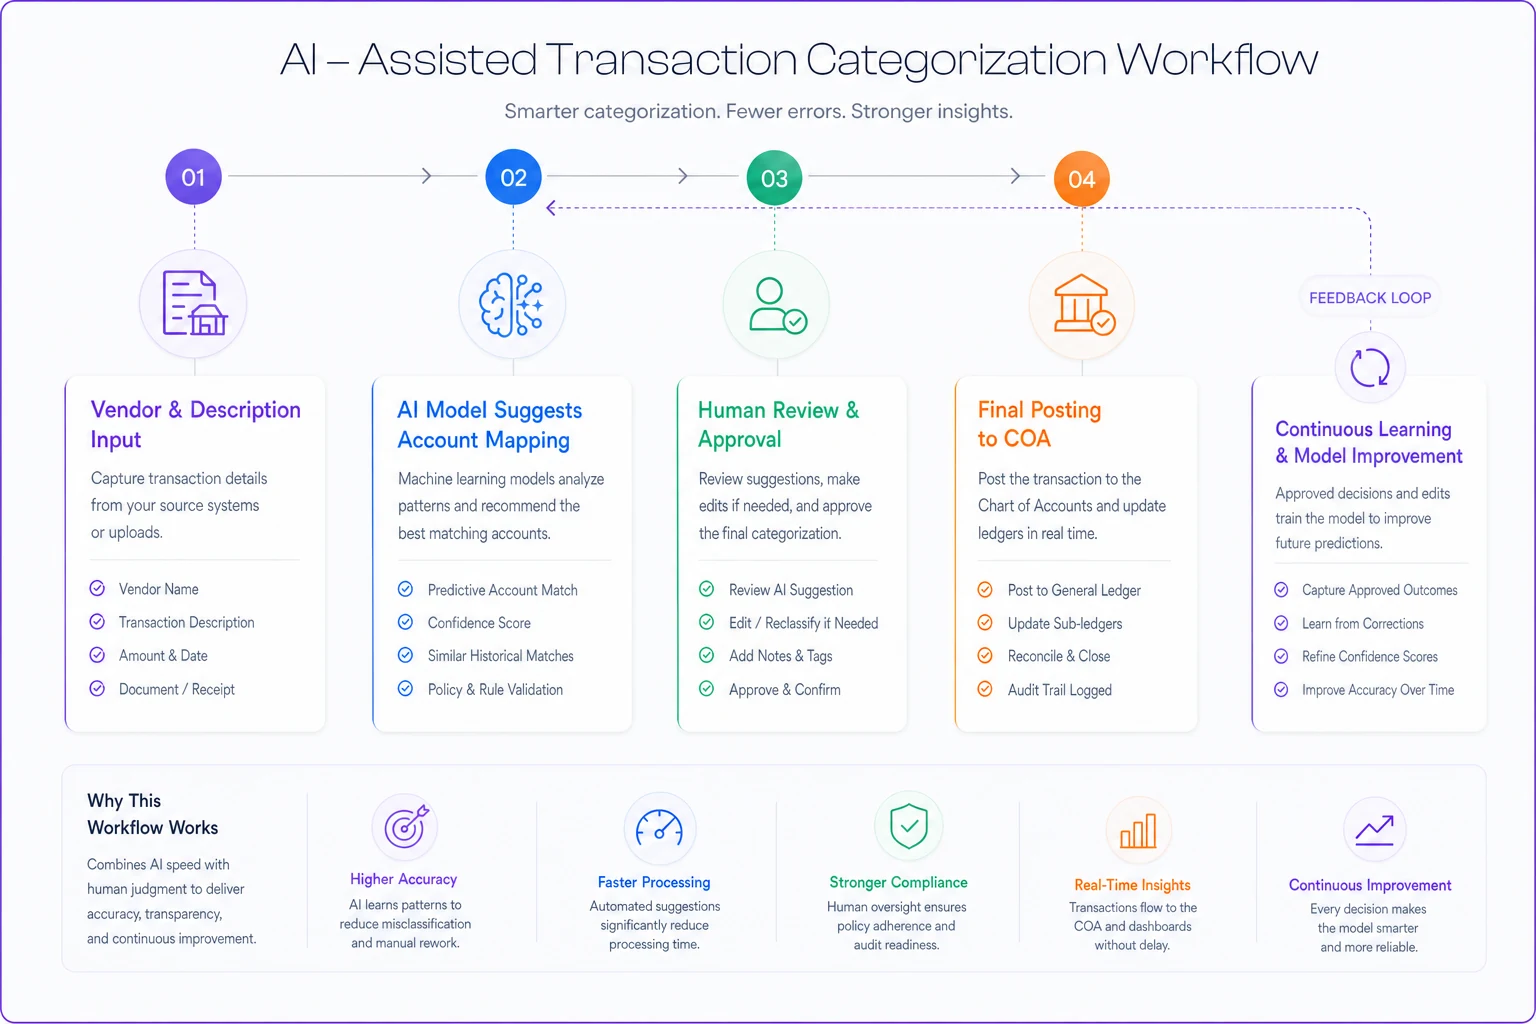
This workflow shows how AI suggestions and human review create a feedback loop that improves categorization over time.
This becomes critical as transaction volume grows. A business processing 50 transactions monthly can manage manual categorization. At 500 monthly transactions, mistakes multiply and review time explodes. AI-assisted categorization maintains accuracy while freeing up time for actual analysis instead of data entry.
AI-powered operational software also helps maintain COA discipline by suggesting the correct account based on vendor, description, and amount patterns. When someone tries to code a $2,000 laptop purchase to "Office Supplies," the system flags it for review. This prevents the gradual degradation that turns good COA structures into messes over time.
Making the structure stick
The best COA design fails if people don't use it consistently. Build these checkpoints into your operations:
Monthly account review
Check for new accounts created outside the system. That "Amazon Expenses" account someone created instead of using "Office Supplies" needs immediate correction before transactions accumulate.
Quarterly usage analysis
Run transaction counts by account. Accounts with fewer than 5 transactions per quarter might need consolidation. Accounts with hundreds might need sub-division.
Annual strategic alignment
As your business model evolves, your COA should follow. Adding a subscription tier? Create the revenue account before you make the first sale. Opening a new location? Set up the full account structure during the lease negotiation, not after opening day.
These reviews catch problems early. A restaurant chain noticed one location coding food waste differently than others. Fixing it quarterly prevented a year-end reconciliation nightmare.
The compound effect of good structure
A well-designed chart of accounts pays dividends that compound over time. Clean historical data makes trend analysis possible. Consistent categorization enables benchmarking against industry metrics. Logical structure simplifies audit preparation and due diligence.
The biggest benefit is operational. When you can instantly see which revenue streams grow fastest, which expense categories creep up, and which locations or products drive profitability, you make better decisions faster. You spot problems while they're still small. You identify opportunities before competitors.
The construction company that spent three weeks fixing their COA? After restructuring, they discovered their commercial projects generated 40% higher margins than residential work, but residential jobs had 3x faster payment terms. They shifted their mix to balance profitability with cash flow. That insight was always in their data — just invisible in their old account structure.
Your chart of accounts isn't just a compliance requirement or bookkeeping tool. It's the foundation of operational intelligence. Build it right from the start, and every financial decision becomes clearer. Build it wrong, and you'll spend more time reconstructing history than building your future.
Your chart of accounts isn't just a compliance requirement or bookkeeping tool. It's the foundation of operational intelligence. Build it right from the start, and every financial decision becomes clearer. Build it wrong, and you'll spend more time reconstructing history than building your future.
Ready to take control of your finances?
Join over 2,000 businesses using Acctaly to simplify accounting, accelerate cash flow, and ensure tax readiness.