


Most finance dashboards for small companies measure the wrong layer. They track outputs — close date, DSO, variance — but tell you nothing about whether the machinery producing those numbers is healthy. By the time your close slips or your AR ages out, the signal is already weeks late.
What's missing is instrumentation: the tooling-level and role-level signals that move before the headline KPI breaks. A reconciliation queue that's quietly growing. A bank feed that's been silently failing for three days. A controller spending 40% of her week chasing approvals in Slack instead of reviewing journal entries.
This is about building that middle layer — connecting your service-level promises to the operational signals that predict whether you'll keep them, with thresholds honest about where you are by headcount. A one-person finance function and a ten-person one should not be measured the same way, and pretending otherwise is how good people end up looking like they're failing.
The three-layer model: SLA → KPI → tooling signal
Every finance SLA you promise to the business should decompose into a KPI you measure monthly, which in turn should decompose into a tooling signal you can watch daily or in real time. Simple concept, almost never actually built.
The relationship looks like this:
-
SLA — the promise. "Monthly financials delivered by business day 6."
-
KPI — the monthly scorecard metric. "Close duration
6 days or fewer."
-
Tooling signal — the leading indicator inside your systems. "Unreconciled bank transactions at BD3," "unposted JEs at BD4," "open reconciliation items older than 48 hours."
The mistake almost everyone makes is stopping at the KPI. You review it at month-end, discover you missed it, then spend time doing forensic archaeology to figure out why. The tooling signal is what lets you intervene on BD3 instead of explaining the miss on BD7.
A worked example of this chain, for a typical SMB finance function:
| SLA (promise) | KPI (monthly) | Tooling signal (daily/live) | Where it lives |
|---|---|---|---|
| Financials by BD6 | Close duration ≤ 6 days | Unreconciled txns, unposted JEs by day | GL / close checklist |
| Vendors paid within terms | On-time payment rate ≥ 97% | AP items in approval > 2 days | AP system |
| Cash visibility within 24h | Bank reconciled daily | Hours since last successful bank feed sync | Bank connection / integration logs |
| Revenue booked accurately | Billing exceptions < 1% of invoices | Failed billing events in queue | Billing / revenue system |
| Reports people trust | Restatement count = 0 | Post-close adjustments after BD6 | GL audit log |
If you already have SLAs written but they're not holding, the problem is usually that you never built the bottom row. The SLA-to-KPI mapping itself is covered in more depth in the enforceable finance SLAs post — this article picks up where that leaves off, at the instrumentation layer.
Why generic KPI lists fail SMB finance teams
Search "finance team KPIs" and you'll get the same list every time: DSO, DPO, close cycle time, forecast accuracy, cost per invoice. All real metrics. All nearly useless on their own for a small team.
Stop letting accounting slow your business down.
Acctaly automates your financial operations so you can focus on growth and compliance.
- Automated bookkeeping
- Real-time financial reporting
- Integrated tax management
No credit card required
The problem is these are outcome metrics, and outcomes have long lag times. DSO is an average of behavior that happened 30–60 days ago. Forecast accuracy tells you how wrong you were last quarter. None of them tell the one bookkeeper or the three-person team what to actually do today.
-
How much of the team's time is reactive vs. scheduled
-
How many manual touches each transaction requires before it's done
-
How often someone has to re-key data that a system already had
-
How long work sits in a queue before it gets picked up
-
How many "exceptions" the team handles that should have been caught by a rule
These are instrumentation and productivity signals, and they move weeks before the outcome KPIs do. A rising manual-touch count shows up long before cost-per-invoice creeps. A growing exception queue shows up before your close slips.
Teams that stay calm through growth watch the second list. Teams that lurch from fire to fire watch the first.
Thresholds change by headcount — stop using one target
A huge source of unfair finance metrics is applying the same threshold across every stage. A solo bookkeeper reconciling 400 transactions a month and a six-person team running continuous reconciliation are fundamentally different machines. Holding them to identical standards either sets the solo person up to fail or lets the larger team coast.
Here's a realistic threshold map across the three stages most SMBs move through:
| Signal | 1–3 person finance | 4–10 person finance | 10–50 person finance |
|---|---|---|---|
| Close duration | ≤ 10 BD acceptable | ≤ 7 BD | ≤ 5 BD |
| Bank feed freshness | Checked daily, fix within 24h | Alert if > 24h stale | Alert if > 4h stale |
| Reconciliation queue age | Clear weekly | Clear every 2 days | Clear daily |
| Manual touches per invoice | 3–4 tolerable | ≤ 2 | ≤ 1 |
| AP items stuck in approval | Review 2x/week | > 48h flagged | > 24h flagged |
| Post-close adjustments | ≤ 3/month | ≤ 2/month | ≤ 1/month |
| % of time reactive/firefighting | 40–50% expected | ≤ 30% | ≤ 20% |
A couple of things worth noticing here.
The reactive time target gets stricter as you grow, not looser. People assume bigger teams naturally firefight more. The opposite should be true — if a ten-person team is still spending 40% of its time reacting, something structural is broken, usually rules and automation that never got built as volume climbed.
The manual-touches-per-invoice number is the single most predictive productivity signal I've come across, and almost nobody tracks it. At 1–3 people, three or four touches is survivable because volume is low. At scale, that same ratio quietly eats an entire FTE. The teams that scale cleanly drive this toward one touch — meaning the transaction flows through capture, coding, and approval with a human only confirming, not keying.
The role-level signals that actually matter
Team-level KPIs hide individual-level problems. A team can hit its close date while one role is drowning and another is barely busy. If you want to actually manage a finance function rather than just report on it, you need signals at the role level.
Here's how the main roles decompose, and what genuinely predicts whether each is healthy:
Bookkeeper / AP-AR clerk
-
Transactions processed per day without rework
-
Rework rate — how often a posted item gets corrected later
-
Queue age for items assigned to them
The signal that matters most: rework rate. High throughput with high rework is worse than lower throughput with clean work, because every correction ripples through the close downstream.
Staff accountant
-
JEs posted vs. JEs reversed/adjusted
-
Reconciliations completed on schedule
-
Time between a reconciliation being assignable and completed
The signal: adjustment-to-posting ratio. If a large share of their entries get adjusted after the fact, either the inputs are bad or review is happening too late.
Controller / finance lead
-
% of time in review vs. % in data chasing
-
Open items escalated to them that should have been resolved by rule
-
Close-blocker resolution time
The signal: data-chasing ratio. Controllers are expensive. When one spends half their week tracking down receipts, approvals, or missing codes, you're paying senior rates for work a rule should handle.
The pattern across all three roles is the same: the dangerous signal isn't volume, it's rework and chasing. Those are symptoms of a process that's leaking, and they show up long before the monthly KPI does.
A realistic dashboard layout
You don't need a BI platform for this. A well-built spreadsheet refreshed from your systems, or a lightweight dashboard tool, covers most SMBs. What matters is the structure, not the tooling.
Organize it in three stacked tiers that mirror the SLA → KPI → signal model:
-
Tier 1 — Daily operational board (watched by the team) - Bank feed freshness (hours since last sync, per account) - Reconciliation queue count and oldest item age - AP items in approval > threshold - Failed/held billing events - Open close blockers (during close week)
-
Tier 2 — Monthly scorecard (reviewed by the lead) - Close duration vs. threshold - On-time payment rate - Billing exception rate - Post-close adjustment count - Manual touches per invoice (sampled)
-
Tier 3 — Productivity and role health (reviewed in monthly ritual) - Reactive vs. scheduled time by role - Rework rate by person/role - Data-chasing ratio for the controller - Adjustment-to-posting ratio for accountants
The common mistake is cramming all three tiers onto one screen. The daily board should be boring and glanceable — mostly green, loud when something's red. The deeper tiers are for reflection, not real-time reaction. Mixing them trains people to ignore the board entirely.
Keep the daily board boring and glanceable — mostly green, loud when something's red.
The daily board should be boring and glanceable — mostly green, loud when something's red. The deeper tiers are for reflection, not real-time reaction.
Here's a simple workflow visualization of how the tiers feed into each other and into monthly KPIs.
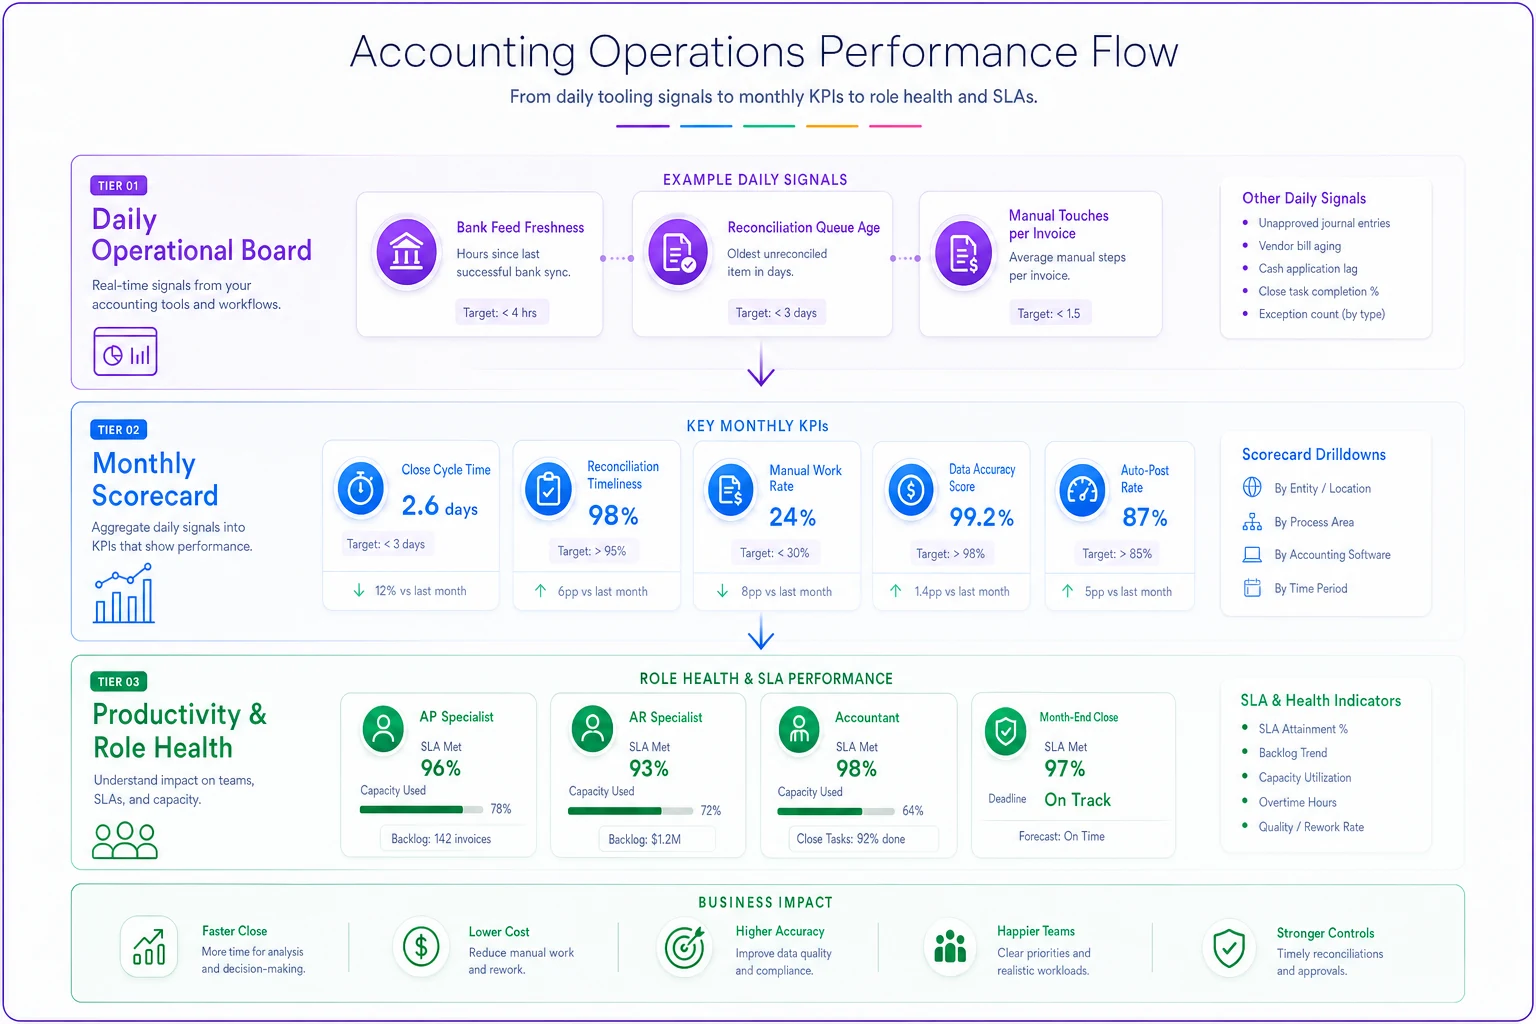
The daily board should be boring and glanceable — mostly green, loud when something's red. The deeper tiers are for reflection, not real-time reaction.
The monthly review ritual
Metrics without a ritual decay within a quarter. The dashboard goes stale, people stop opening it, and you're back to forensic archaeology at month-end. The ritual is what keeps the system alive, and it doesn't need to be long.
A 45-minute monthly structure that works for teams from 1 to 50:
-
Start with the misses, not the wins (5 min). Any SLA missed last month? Pull it up first. No defensiveness — the question is which tooling signal should have warned you earlier, and whether you missed it or simply didn't have it.
-
Walk the tooling signals that preceded the miss (10 min). Trace backward from the broken KPI to the daily signal. If the close slipped, when did the reconciliation queue start growing? This builds the instinct to watch leading indicators rather than outcomes.
-
Review role-level productivity signals (10 min). Rework rates, data-chasing ratio, reactive time. Look for a role trending the wrong way before it blows up.
-
Check thresholds against headcount (5 min). Did you add a person? Hit a volume milestone? Thresholds should ratchet. This is the step everyone skips, which is why metrics feel unfair six months later.
-
Pick exactly one process fix (10 min). One. Usually it's converting a recurring exception into a rule, or removing a manual touch. Resist the urge to fix five things — you'll do none of them.
-
Confirm the one owner and the one date (5 min). The fix has a name and a deadline before anyone leaves.
The discipline is the one fix rule. Teams that try to overhaul everything after a bad month overhaul nothing. Teams that compound one real improvement per month are unrecognizable in a year.
If your close is the thing that keeps breaking these reviews, the mechanics of fixing it are worth their own treatment — we laid that out in the predictable monthly close system post.
A real scenario: the e-commerce brand that was "always almost done"
A direct-to-consumer brand doing roughly $6M–$7M a year ran a two-person finance function — one bookkeeper, one part-time controller. On paper their KPIs were fine. Close landed around BD8, DSO was stable, nothing screamed.
But the controller was burning out, and nobody could explain why based on the monthly numbers.
When they finally instrumented the layer underneath, the picture was obvious. The bookkeeper was logging three to four manual touches per order-related transaction — marketplace payouts came in lumped, got split by hand, re-coded, then half of them got adjusted during close anyway. Rework rate on those entries was sitting near 25%. The controller's data-chasing ratio was brutal: close to half her week spent reconstructing split payouts and tracking down which transactions belonged where.
None of that showed up in close duration or DSO. It showed up as a controller quietly working nights.
The fix was unglamorous. They set a daily reconciliation-queue signal, built coding rules for the recurring payout patterns so they stopped being hand-split, and started tracking manual touches as an actual metric. Over about two months, manual touches per transaction dropped toward one or two, rework fell under 10%, and close pulled in to around BD6. The controller's data-chasing time came down to something like a quarter of her week.
The headline KPIs didn't change overnight. What changed was that the signals predicting the fires were finally visible — so the firefighting stopped.
When this is worth the effort — and when it isn't
When it makes sense:
-
You've missed finance SLAs and genuinely can't explain why until after the fact
-
A key person is overloaded but the team-level metrics look fine
-
You're adding finance headcount and want thresholds that scale with you
-
Your close or AR performance swings month to month with no obvious cause
When it's premature:
-
You're a true solo operator with low transaction volume and a clean close — a daily board is overkill; a weekly glance is enough
-
You haven't written SLAs or KPIs yet at all — build those first, then add the instrumentation layer underneath
-
Your systems are too fragmented to pull clean signals — fix the data plumbing before building dashboards on top of it
Who should not do this: anyone treating it as a surveillance tool for individual blame. Rework rate and data-chasing ratio exist to find broken processes, not to rank people. The moment the team believes the dashboard is about catching them, they'll game it — and every signal you built will go quietly fictional.
The takeaway
Generic finance KPI lists measure outcomes that already happened. The teams that stay in control measure the layer underneath — the tooling signals and role-level productivity indicators that move first.
Decompose every SLA down to a daily signal. Set thresholds that ratchet as you add people. Protect a short monthly ritual that traces misses backward to the signal that should have warned you earlier. Do that consistently, and the headline KPIs mostly take care of themselves — not because you watched them harder, but because you finally started watching the right things.
Decompose every SLA down to a daily signal. Set thresholds that ratchet as you add people. Protect a short monthly ritual that traces misses backward to the signal that should have warned you earlier.
Ready to take control of your finances?
Join over 2,000 businesses using Acctaly to simplify accounting, accelerate cash flow, and ensure tax readiness.